Panic!!!
There is a group of people calling themselves the BC Modelling Group which released a presentation yesterday. They are quite alarmed by the rise of the VOCs, and foresee an explosion of cases.
There is also a guy Eric Feigl-Ding who has also been sounding the alarm about the levels of P.1 in BC, e.g. this tweet.
These people are not wrong that we have a lot of P.1, they are not wrong that our health care is getting slammed, but there’s an edge of DO SOMETHING DO SOMETHING DO SOMETHING!!!!!!!!!!! which completely misses that we are doing something. For example, public health closed the restaurants, has been closing businesses with outbreaks, is vaccinating all of Whistler, vaccinated all the educators in Surrey already, and is vaccinating Vancouver educators and Surrey first responders right now. This is not “doing nothing”, and it appears to be having an effect. While cases have not gone down a lot, they are going down a little. Importantly, they are not zooming up.
Also, a pet peeve of mine: Eric Feigl-Ding keeps saying that we have the highest P.1 rate outside of Brazil, and that’s just not true. We have the highest known rate outside of Brazil because we actually measured it.
Press Conference
See slides for today’s press conference showing data/modelling and workplace clusters.
Hotspots
Dr. Henry showed maps and “dot plots” of where cases have been happening. No surprises: Surrey was and is a hotspot; Prince Rupert was but is back under control; Whistler is a hotspot (but they are vaccinating there right now). The highest rates right now are in Whistler and Peace River South, while the highest number are in Surrey.
She showed a graph of where cases came from, and the proportion of “we don’t know” has gone up quite a bit recently. Dr. H said something about unchecked spread in the community, but realistically, I bet their contact tracers are also getting overwhelmed. There are 10K active cases now and 16K people under monitoring!
She talked a little about how they use this geographically linked data to help target interventions. For example, this is why they started vaccinating teachers in Surrey first, it’s why they are vaccinating first responders in Surrey before other jurisdictions.
She said that the “circuit breaker” measures are starting to blunt the transmission slightly, that many indicators are going down — slightly. (I’m just glad that they are not exploding!)
Multiple times, she talked about how the variants make everything harder. What used to be safe (like dining in restaurants) is no longer safe. Before, when you had one person in a household sick, they might spread to one other person and now everybody in the household will get sick.
She mentioned that the positivity rate was dropping slightly, but the graphic she had made it impossible to tell. It’s much easier to see with this graph:
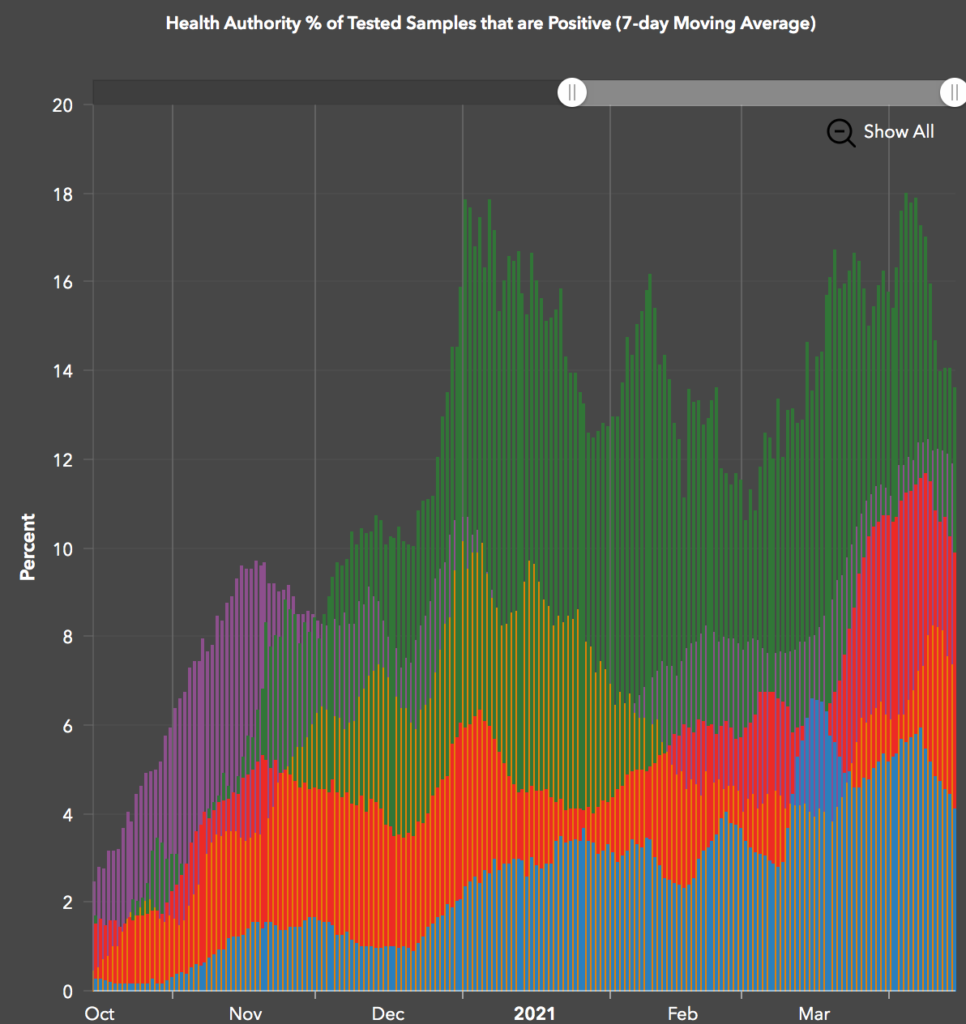
(Green is Northern Health, purple is Fraser Health, red is VCH, orange is Interior, and blue is Island.)
Age distribution
She talked about the age distribution of hospitalizations and deaths, and it sure looks to me like the VOCs don’t really change the age profile much:
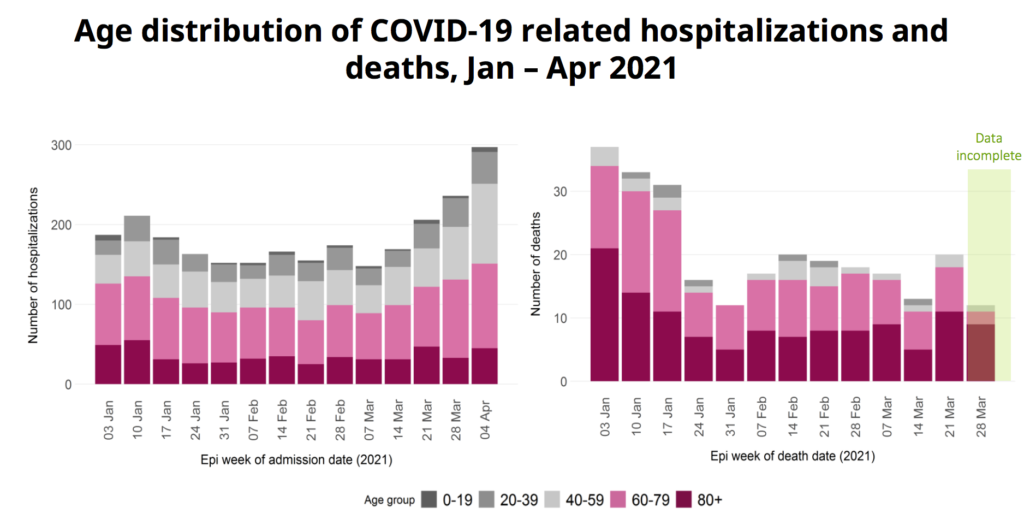
Vaccinating old people really does change the age profile of deaths.
VOCs
Dr. H said that they have a new screening test — i.e. one which takes about a day — which can tell not only if it’s probably a VOC, but also if it’s B.1.1.7. They will no longer do whole genome sequencing on the samples which the screening says are B.1.1.7.
She said they would reserve whole genome sequencing for targeted populations (e.g. travellers, hospitalized patients, reinfections), clusters, outbreaks, and random testing for general surveillance. They will include this in the situation report in figures like this:
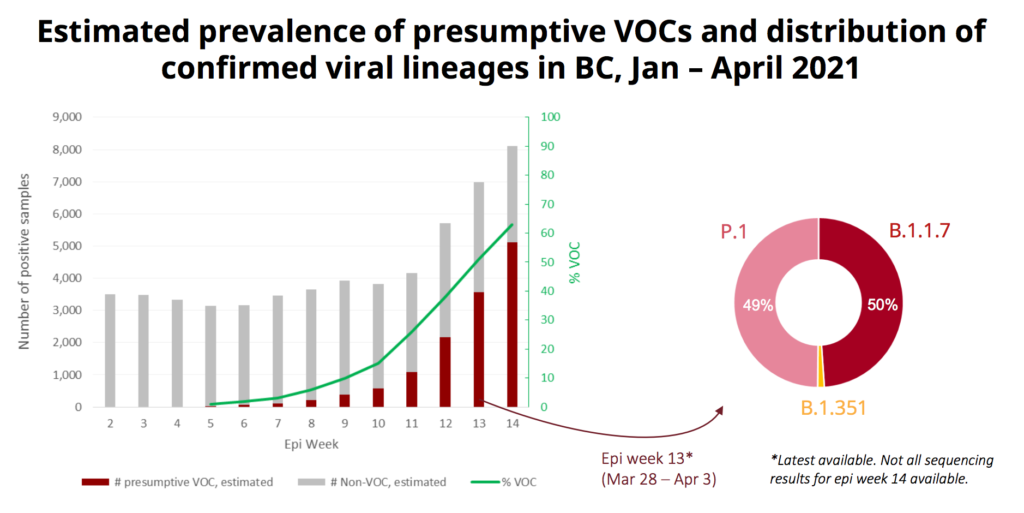
The proportion of VOCs is very different in different places:
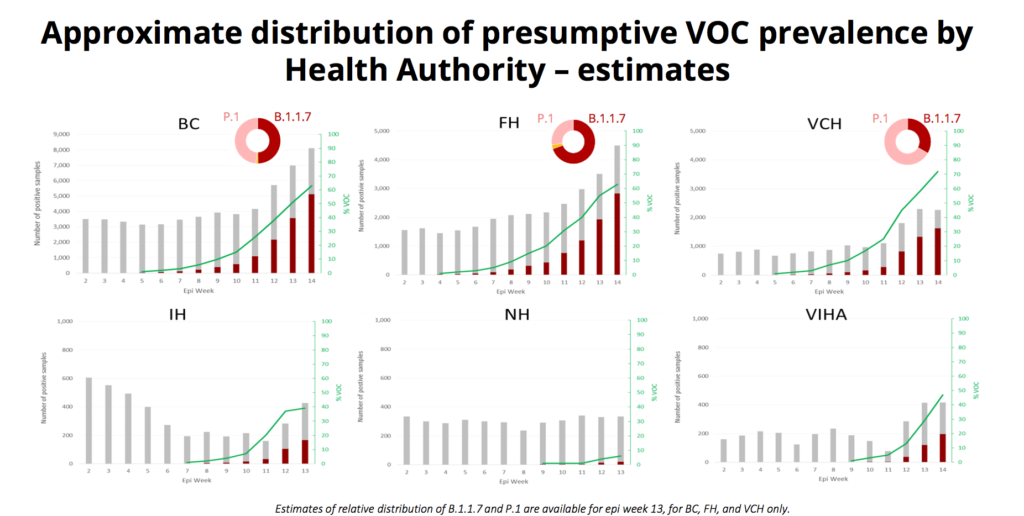
In Fraser Health, it’s been mostly B.1.1.7, while in VCH it’s been mostly P.1. (From the previous slide, the dark red bars are the VOC cases and the grey bars are the non-VOC cases, and the doughnut shows the proportion in the latest week where data is available, which will usually be the next-to-last week.)
Schools
Dr. Henry has said over and over again that schools are not drivers of infection, that they reflect what is happening in the community. Today she shows a graph which seems to back her up:
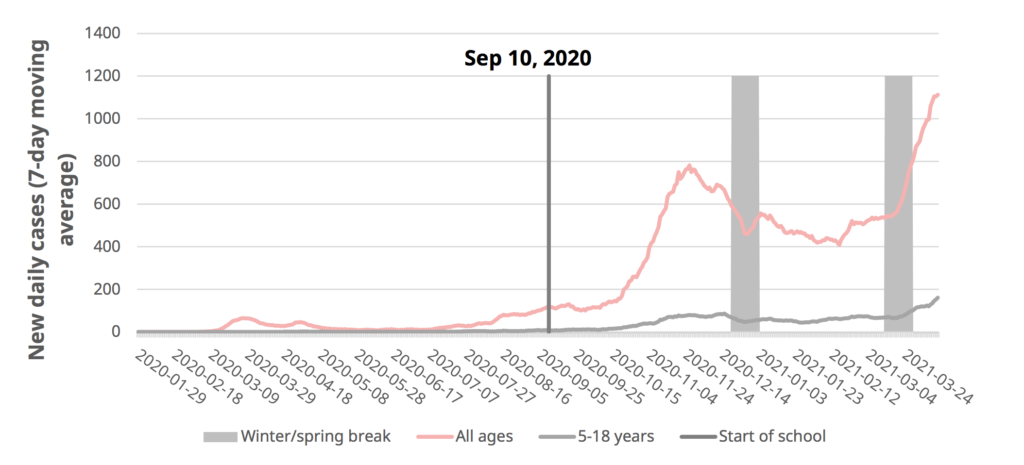
The all-ages case rate changed abruptly right when Spring Break started, and the kids’ rate started going up at the same time. (Reminders: the seven-day rolling average is a lagging indicator, and the case count went down over the Winter Break because people weren’t getting tested.)
She emphasized that children still have a very low infection rate, way below their share of the population. She showed a chart which did in fact show that younger kids were significantly underrepresented, though teenagers get ill at roughly the same rate as the population at large. No child has died of COVID in BC, and their hospitalization rate is 1/10th that of adults.
They did two in-depth studies of transmission in schools, one in VCH (Sept 10 – Dec 8) and one in Fraser Health (Jan 1 – Mar 7).
In VCH, less than 1% of the students/staff got COVID, and of those, only about 8% probably got it at the school. Holidays did not cause rates in students/staff to go down:
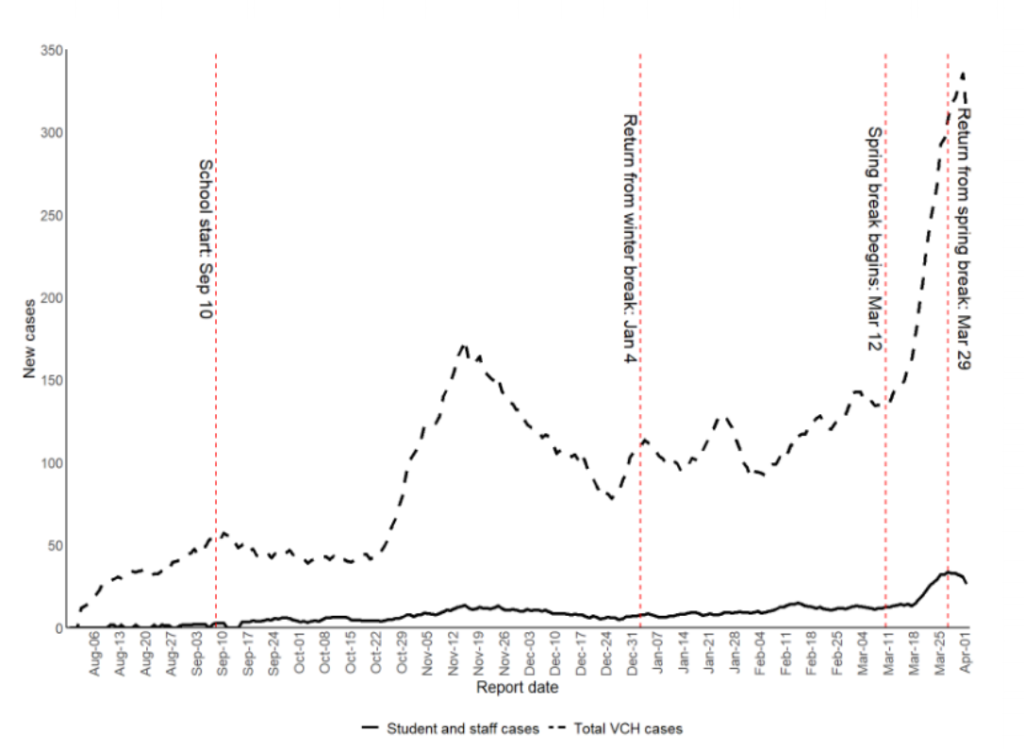
In the FH study, they found less than 1% of the students/staff got COVID, and only 13% of those appeared to have been in-school transmissions.
Rt
Dr. H showed a graph of Rt, showing that R is coming down in many places:

(The legend says that the charts go to March 11, but clearly they show data in April.)
She said that the rate of infectious contacts we are having is around 55-60% (compared to pre-pandemic, I believe), and that is too high. At that rate, we’re in trouble. She says we need to get back down to like 40%, which is where we were in March 2020 and November 2020.
She reminded us to please do the survey.
Sources
The video was glitchy, and there was about 5m which I did not see. They provided slides on where infections were happening, but I didn’t see it and couldn’t find it in the video later. Justin McElroy made a very nice visualization:
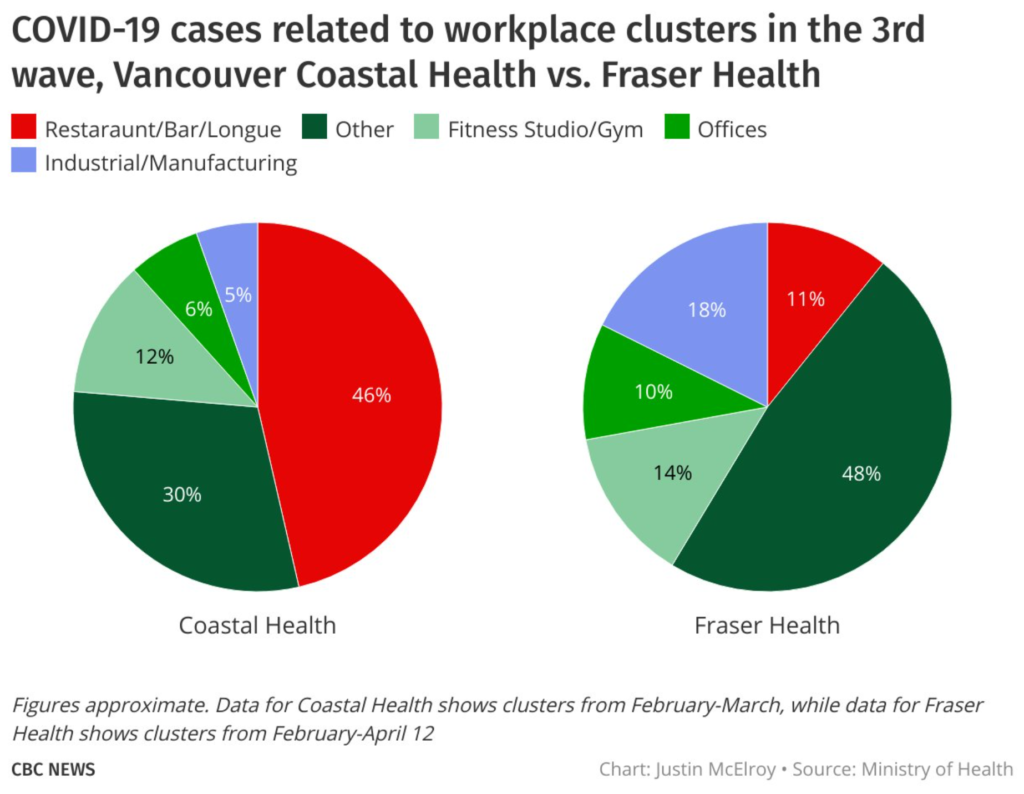
I found it interesting how different the two regions were, and I was shocked at how much transmission in VCH came from restaurants!
Vaccinations
Dix was really pleased with how the vaccinations are going. By today, 26.7% of eligible BCers (which means adults, basically) have been vaccinated.
He talked about delivery, how this week we got 138K of Pfizer and 43K of AZ, and are still waiting on 105K of Moderna which we are due. Still.
Hospital capacity
Dix gave numbers on hospital occupancy:
- base bed occupancy 92.4%, currently with 714 vacant beds
- total beds (surge+base) 11939, currently with 3117 vacant
- acute care base bed occupancy 80.5%, currently with 105 vacant acute care base beds
- acute care total beds (surge+base) 780 total, currently with 339 vacant, giving an occupancy rate of 56.5% across the province.
He says we have “touched the surge beds” in a few places, about 3%. I don’t know what that 3% means, unfortunately.
He says we do have, as of today, 8822 in acute care, which is not high compared to pre-COVID, but the pressure on staff is considerable. I guess COVID patients take more effort to treat than most acute care patients.
Online registration
Dix said that 1,048,547 have registered for appointments and 362,857 people have booked appointments. I don’t know if that is just through the online system, or if it is online and phone both.
Q&A
Remember, these are all heavily paraphrased and snarky.
Q: The school studies you showed were before the VOCs showed up, are things different now? A: Well, actually, the Fraser Health study was done recently enough that there were a lot of VOCs.
Q: Hundreds of people who have gotten vaccinated have gotten sick, have any died? A: We have data linking vaccination with health records, so we know that about ~400 people got COVID more than 14 days after their first dose — that’s about 0.07%, a very low rate. That’s probably an overestimate because people might have been in their incubation period before they got the full benefit of the vaccination.
We’ve also had several dozen cases where people have gotten sick at least a week after their second dose, and that works out to 0.04%, an even lower rate. The vaccines are really really good.
I am not aware of any deaths from anyone who was vaccinated, but I’m a few days out of date, it could have happened in the past few days. There was one death in a long-term care home after immunization in someone who was over 100 years of age.
Q: We have the same restrictions that we had in November/December, but now we have variants, shouldn’t we be doing something different? Why aren’t we doing more? A: The things that you need to do haven’t changed, we just have no more margin of error. NB: Also, we are doing different things: they closed Whistler-Blackcomb, they closed restaurants, they are vaccinating Whistler, they vaccinated the Surrey teachers, etc. etc. etc. Why do people keep thinking pub health is just sitting around twiddling their thumbs?
Q: The dynamic model which you showed indicates that if we don’t modify our behaviour, we’ll hit 3000 cases/day at end of April. Right now we’re wrecked with 1100 caes/day, so if we don’t amend our contacts, what does that mean for hospitals? A: Hospitalizations are a lagging indicator, so we will see hospitalizations. That’s why the age-based vaccination is so important, especially down to age 40 or so.
Q: How much of Moderna/Pfizer being diverted from the age-based track to profession-based track? A: Less than 10%, which is why we have had to focus our profession-based track based on geographical location.
Q: Ontario is in deep shit, you said that we were about a month behind Ontario, does that mean we are going to be in deep shit in a month? A: You’re misquoting me slightly, I said that we were about a month behind Ontario in terms of what fraction of our cases were VOCs. Pandemics are different in different places due to different variants, different population demographics, different weather, different events, etc. so we have to chart our own course. Obviously we are watching ON carefully.
Note that we came up with a plan on how to deal with slammed hospitals over a year ago, and we still have that plan. We also have good coordination between hospitals and health authorities where we can shift patients around if we have to. Obviously that’s hard on the families, but we have proven we can do this. NB: She’s referring to when the UNBC hospital got slammed last year. We’ll talk a little more about hospitalizations on Monday.
Q: Do we need to change isolation policies because of the increased transmissibility of VOCs? A: We have a lower tolerance now. A lot depends on the specific situation: the number of people, the size of the house, where those people work, etc. The case management/contact tracers work with all that to come up with an isolation plan.
Q: We get a lot of flights from India, have we seen the Indian double-mutation variant, B.1.617? A: I’m not sure off the top of my head, I’ll get back to you.
Q: You said we were testing bamlamnivimab in Surrey Hospital, how’s that going? A: We’ve had a hard time enrolling people in the study. We’ve had a few enroll, I am not sure how it is going.
Q: VCH showed that there was lots of transmission in restaurants, was that within the staff, or was it also staff-to-customers? A: A little of both. We found that when people followed the COVID Safety Plans, it worked, but unfortunately we saw a lot more of patrons pushing the limits. In those areas, we saw transmission both between staff and patron and staff with household. With the VOCs, those little bits of leeway were no longer enough to protect people in indoor settings. Same thing with gyms and fitness centres: things that had been working well were starting to be taken advantage of and we started to see transmission from some of the group activities.
Q: You showed that mass vaccinations were important in Prince Rupert and Whistler, but Surrey has been in the shitter for a long time, when are you going to pay attention to Surrey??? A: Uh, we have been paying attention to Surrey: they got the first educator mass vax, they are getting the initial first responder mass vax, a lot of the businesses which we inoculated are in Surrey, we have done a lot of work making sure that we’ve got translations into locally-used languages, we have been working with community organizations to do outreach, etc. Surrey is too big for us to be able to vaccinate everybody there at once, alas.
Statistics
Today: +1,205 cases, +3 deaths, +44,952 first doses, +79 second doses, +~9290 AZ doses.
Currently 409 in hospital / 125 in ICU, 10,052 active cases, 16,217 under monitoring, 104,331 recovered.
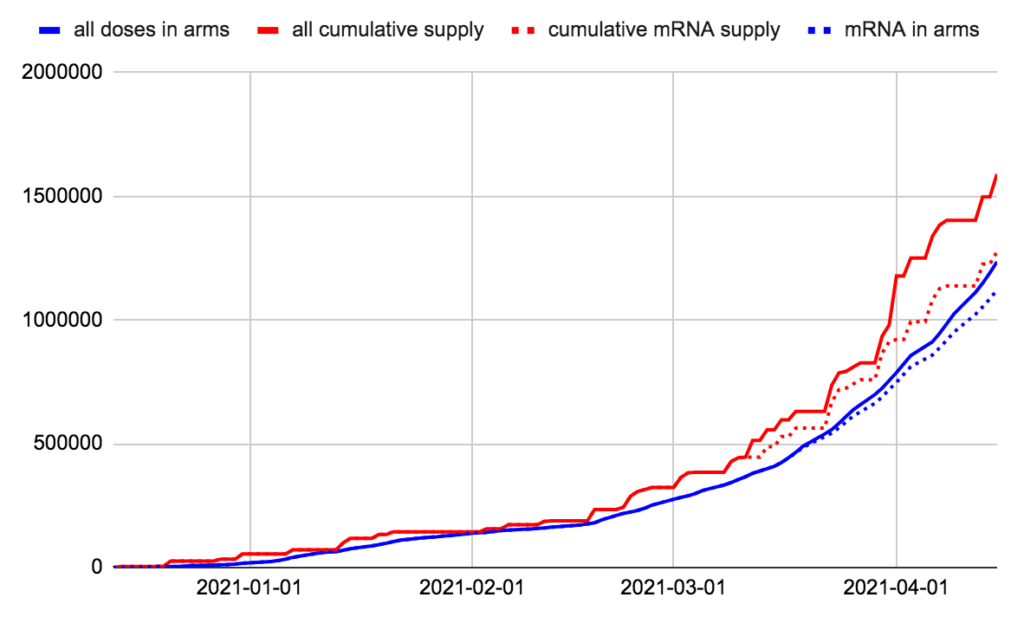
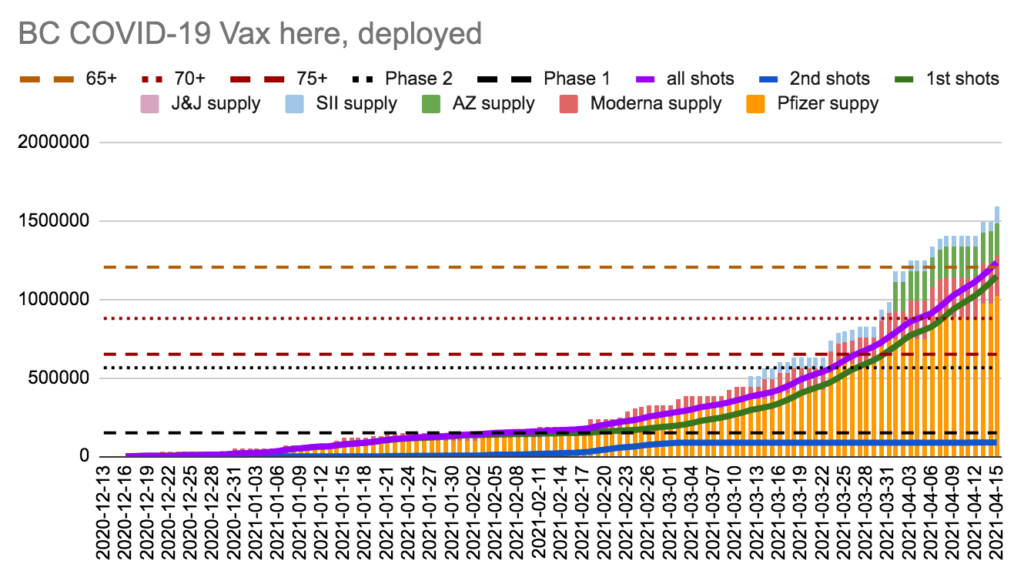
We have 354,607 doses in freezers, which we’ll use in 7.9 days at today’s rate. We have given more doses than we had 13 days ago.
We have 154,078 doses of mRNA in freezers, which we’ll use in 4.3 days at today’s mRNA rate. We have given more mRNA doses than we had 3 days ago.
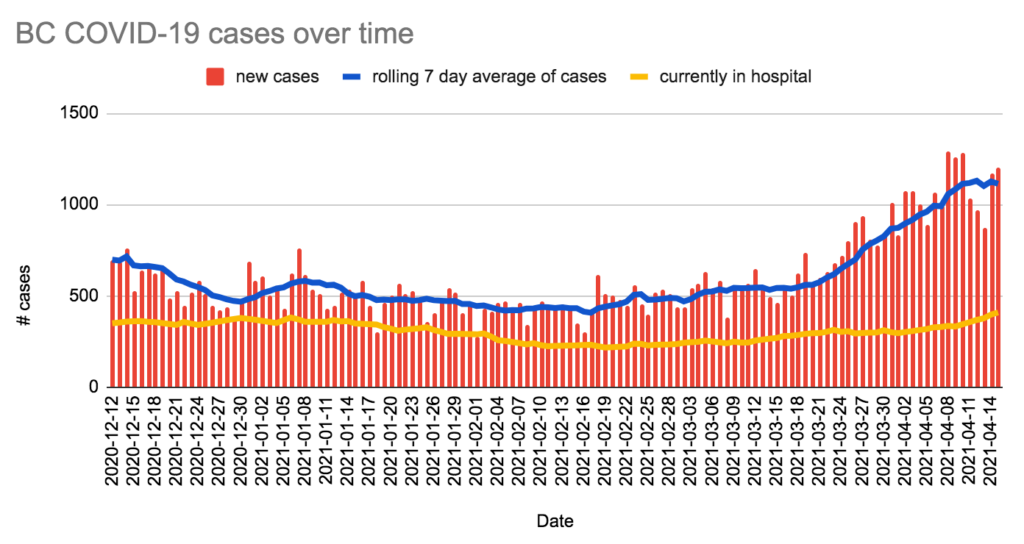
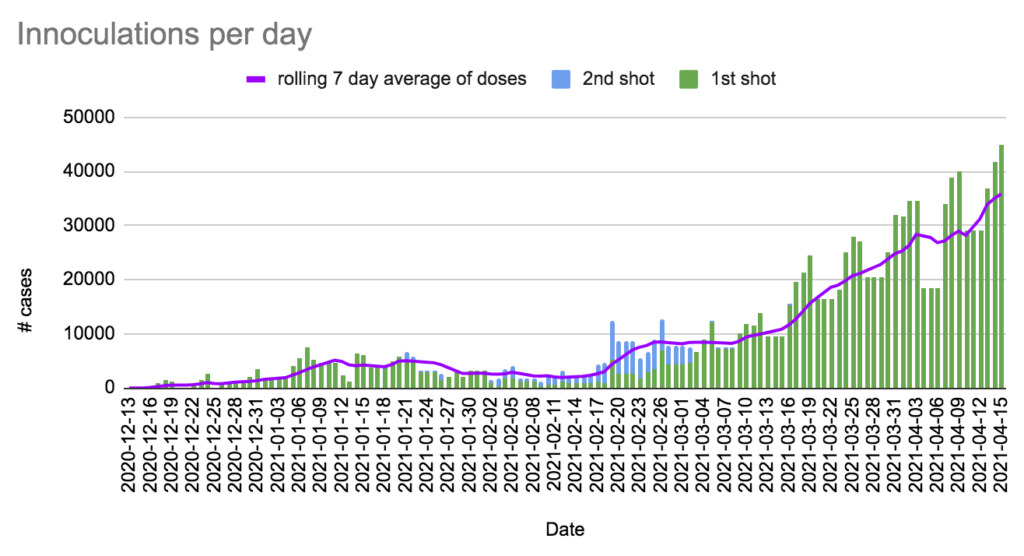
Charts