Statistics
Provincial weekly data releases have resumed effective today. That’s the good news. The bad news is that the statistics are different and not as transparent: the raw numbers are no longer published, just graphs (usually per million people). (This provincial report says the BC population is ~5.6M, by the way.)
They have also removed information about the number of people in critical care with COVID-19. They have moved the positivity and case information to the Viral Pathogen Characterization page (again, as graphs).
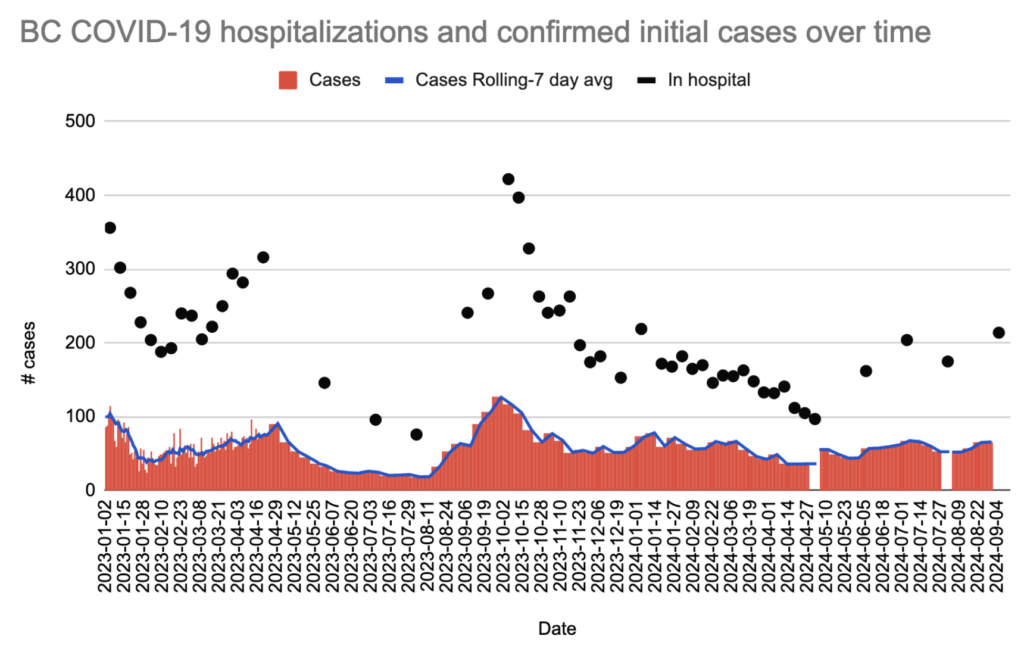
They aren’t publishing how many people there are in hospital any more, but they are publishing a graph of the number of people in hospital, which I have traditionally made. Here is my previous version (with the scale adjusted to show per million instead of raw numbers):

Here is their graph (note that their graph’s years start in August and repeat, while mine shows a longer, continuous timescale and because of that, the x-axis scale is different):

I mentioned that I can pull the raw numbers off of the chart, but if I hover on their chart, it tells me that as of Sept 21, there are 181.71 patients in hospital with COVID-19.
Excuse me? How do I have a fractional number of patients in the hospital? It’s probably a rolling seven-day average, but they don’t say that anywhere. (Note that a rolling seven-day average makes the data even more laggy than the raw numbers.)
So I could pull numbers off of their charts, but I’m so dispirited that I’m not sure I have the will to put in that manual effort. I could probably reverse-engineer my way to get at the data, but it would be a pain in the posterior.
I have the feeling that they want people like me to lose motivation and give up. I think they are succeeding.
Charts
From the BC CDC Situation Report (these are all weekly per million numbers):


From the Viral Pathogen Characterization page:

Reminder: the graphs below don’t tell how many cases there were, but how many cases they found when testing. Almost nobody gets tested.

COVID-19 or a “summer cold”?
A few weeks ago, I wrote a post which said that all the “summer colds” were probably COVID-19. Now that the province has updated the summer pathogens data, I can tell you that for the week ending 3 August 2024 (for example), a “cold” was 3.87 times more likely to be COVID-19 than any other respiratory pathogen in BC.
Furthermore, “really bad colds” are usually COVID-19, flu, or RSV. In the week ending 3 August 2024, “a really bad cold” was 28.0 times more likely to be COVID-19 than the flu or RSV. See more details in the addendum to my original post.
Wastewater
From Jeff’s wastewater spreadsheet:

