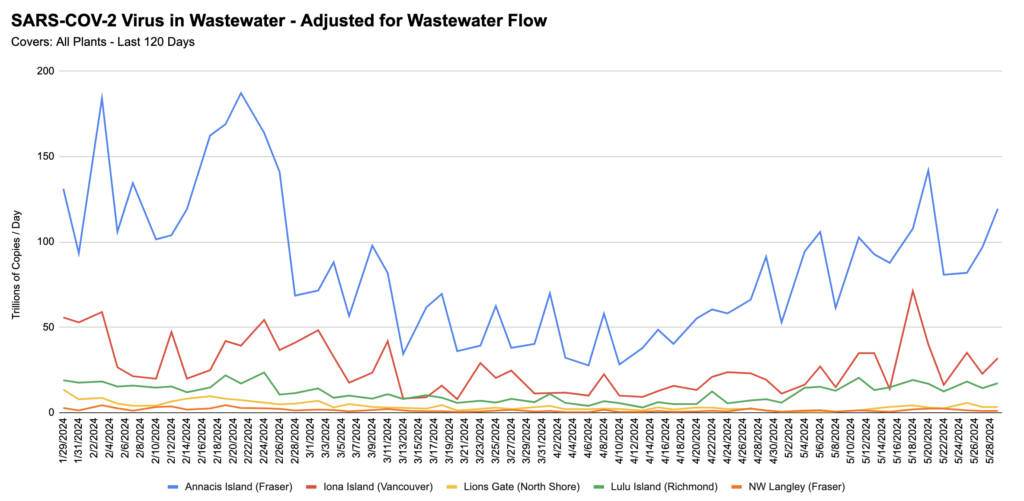
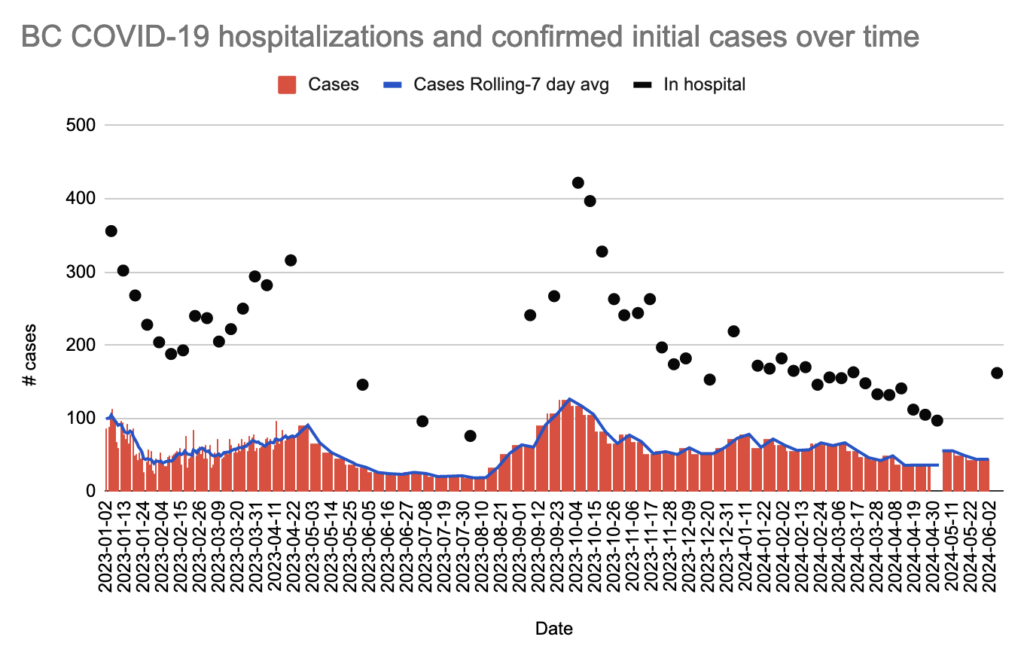
COVID-19 wastewater and hospitalizations (the most reliable indicators!) are indisputably going up.
COVID-19 Statistics
As of 6 June, the BC CDC situation report says that in the week ending on 1 June there were: +310 reported cases, +93 hospital admissions, +11 ICU admissions, and +16 thirty-day all-cause deaths*.
In the week ending 25 May, they now report that there were +308 reported cases, +126 hospital admissions, +17 ICU admissions, and +15 thirty-day all-cause deaths*.
In the week ending 18 May, they now report that there were +390 reported cases, +107 hospital admissions, +9 ICU admissions, and +24 thirty-day all-cause deaths*.
*All-cause deaths in people who had a positive COVID-19 test in the prior 30 days, that is.
There were 162 people in hospital and and I do not have information on the number in critical care with COVID-19 on 6 June.
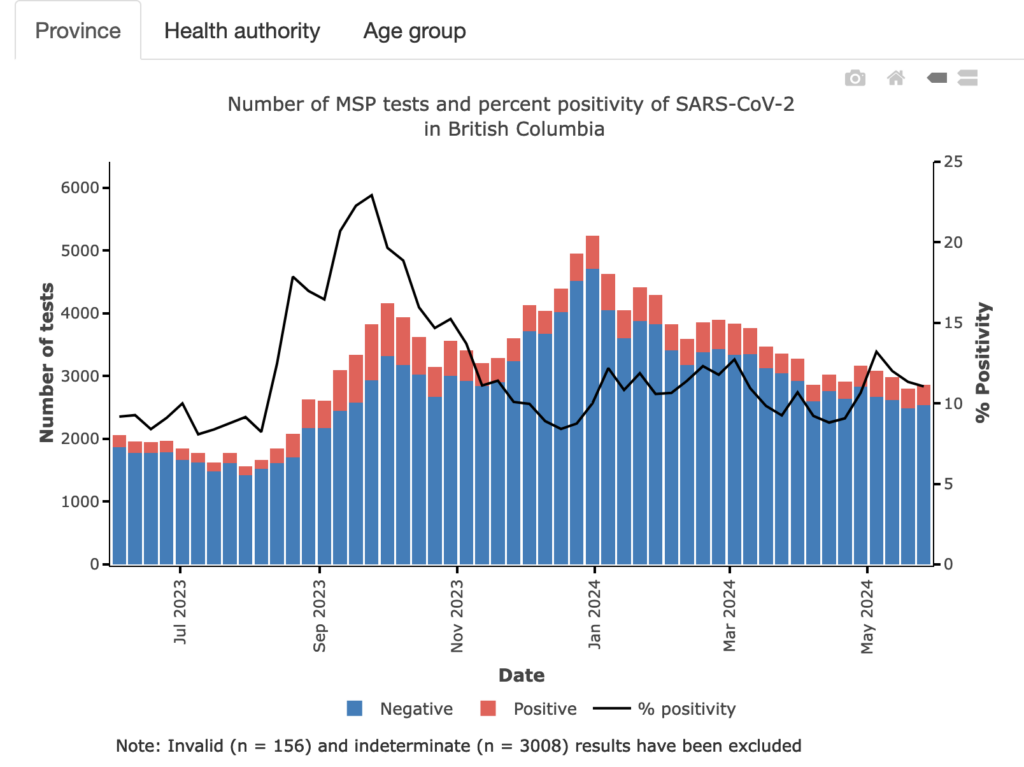
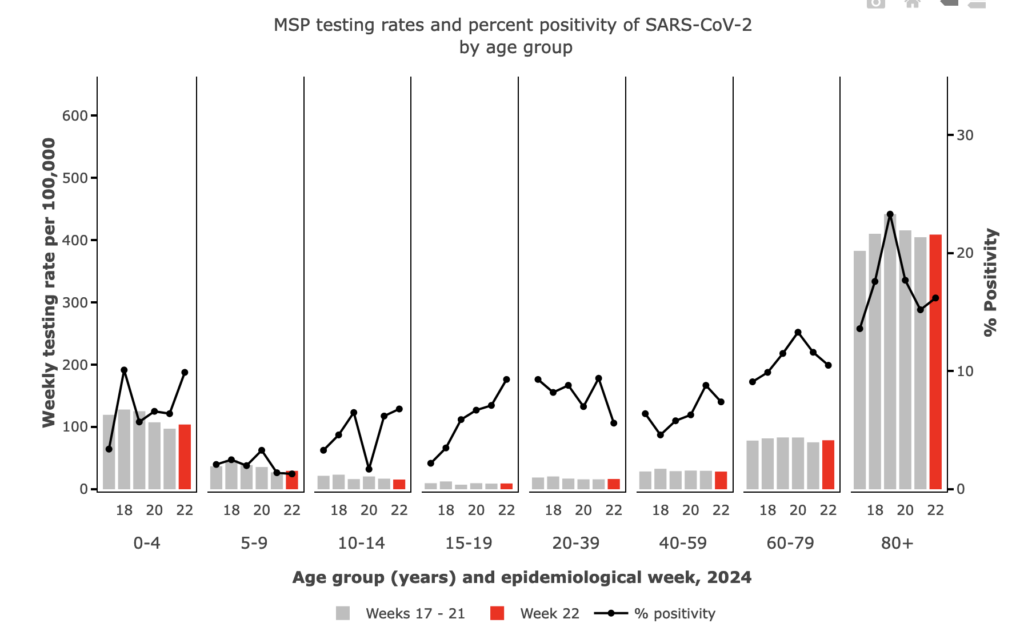
Charts
From the BC CDC Situation Report:

From Jeff’s wastewater spreadsheet: