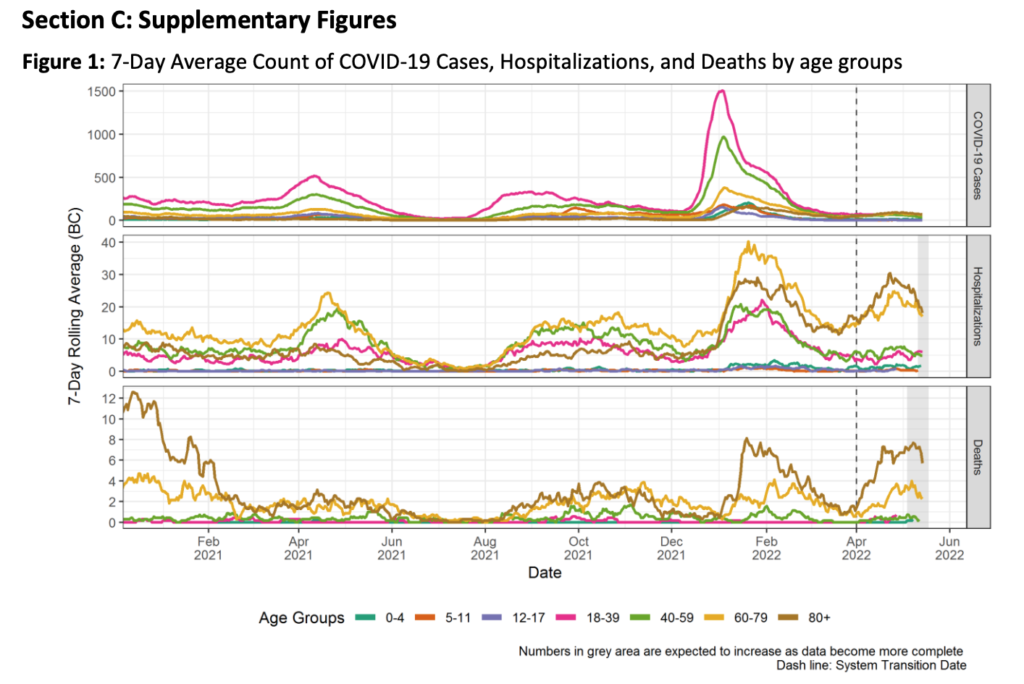
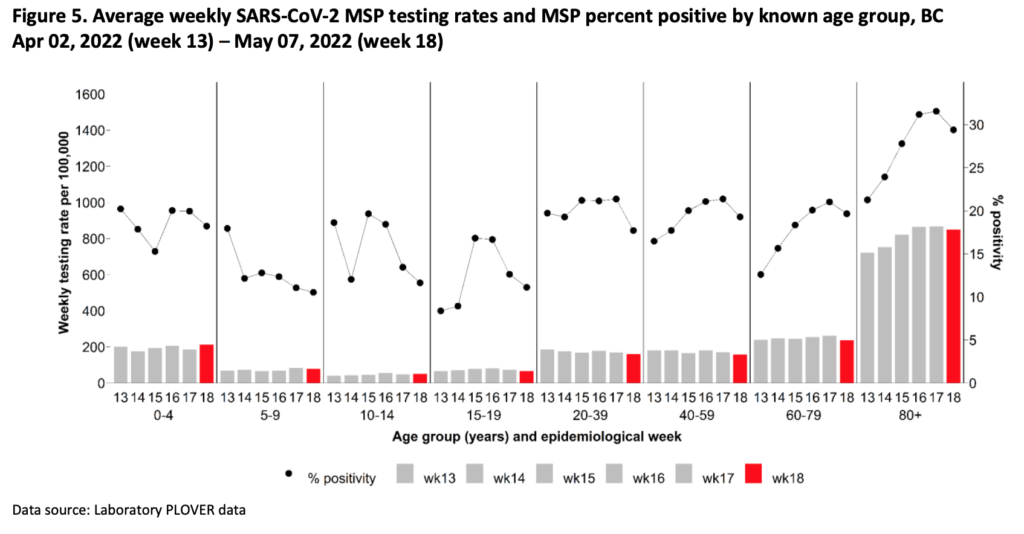
I want to make a cautionary note about the stats. For about six weeks now, the over-70s and clinically extremely vulnerable have been eligible for second boosters. Note that those are also the only group which is eligible to get walk-in PCR tests, so the only ones (aside from hospital admits) who show up in the official case count numbers.
This means that we could be seeing something here where there is a drop in cases in the over-70s and CEVs due to the boosters, while there is NOT a drop in the under-70 non-CEVs.
Statistics
The BC COVID-19 Modelling Group has issued another report, and it says… uh… lots of things, some of which I agree with and some of which I do not.
They say that wastewater data is not inconsistent with falling cases, but pffft, the wastewater data is too noisy to really tell.
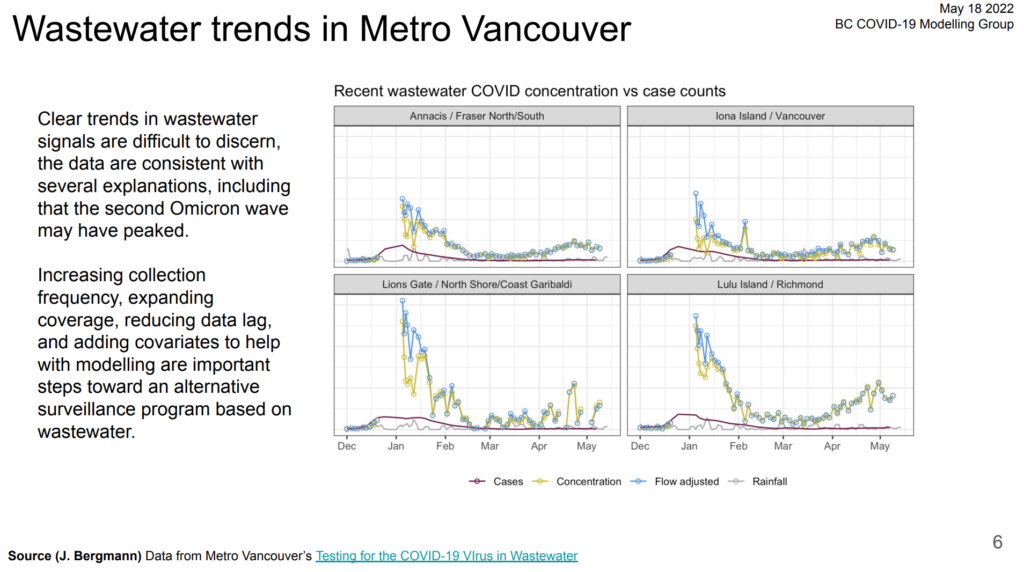
(Note that the y-axis is not labelled!)
Here’s the wastewater data for the last 60 days from my buddy Jeff’s site:
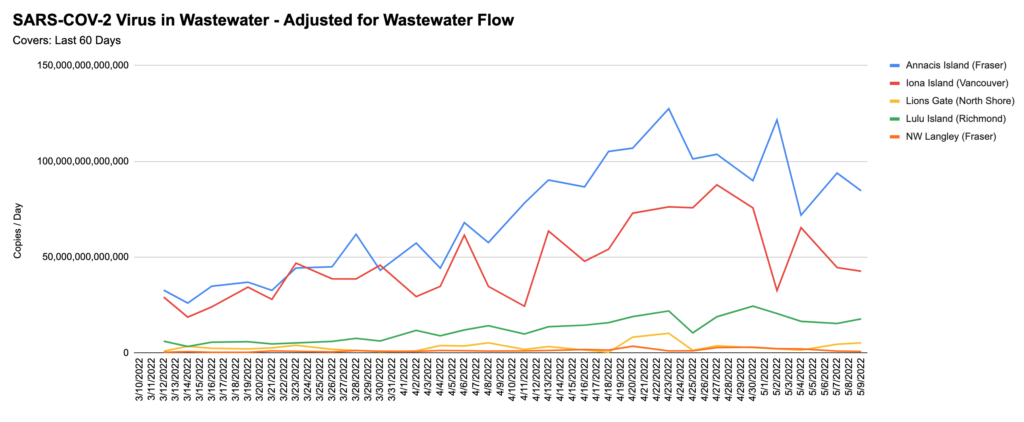
Yeah, it looks like it is going down in Fraser and Vancouver? But it’s so noisy that it’s hard be sure.
One of the most important things they do is estimate the under-70 case rate based on the over-70 case rate. Their rationale is that the over-70 rate did not change when the testing regime changed, and that the under-70 case curve was parallel to the over-70 case curve before the testing regime changed, so it should be parallel now. In general, I think that’s a clever and fine approach.
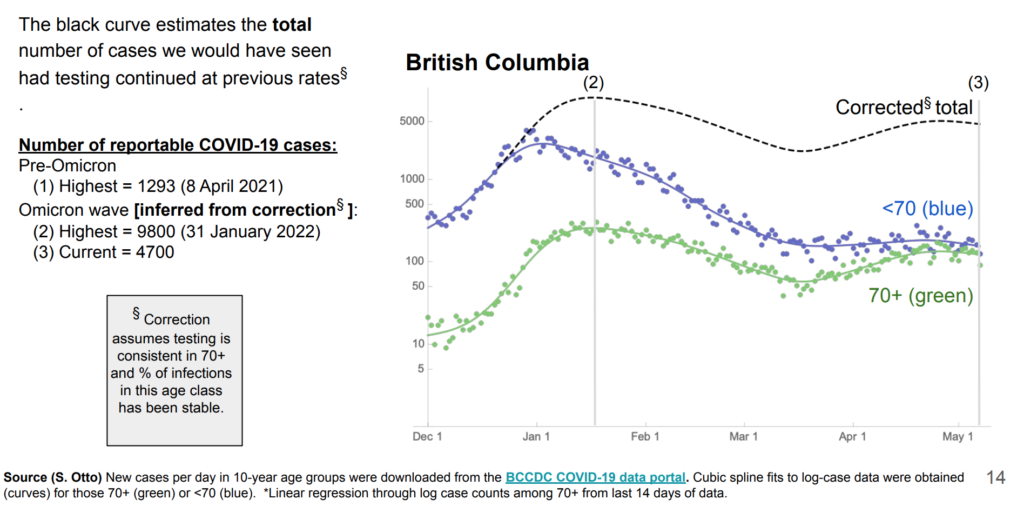
HOWEVER, they are using a recent dip in rates for the over-70s to justify a dip in the under-70s rate, WITHOUT acknowledging that the over-70s just just got their second boosters (well, starting 5 April).
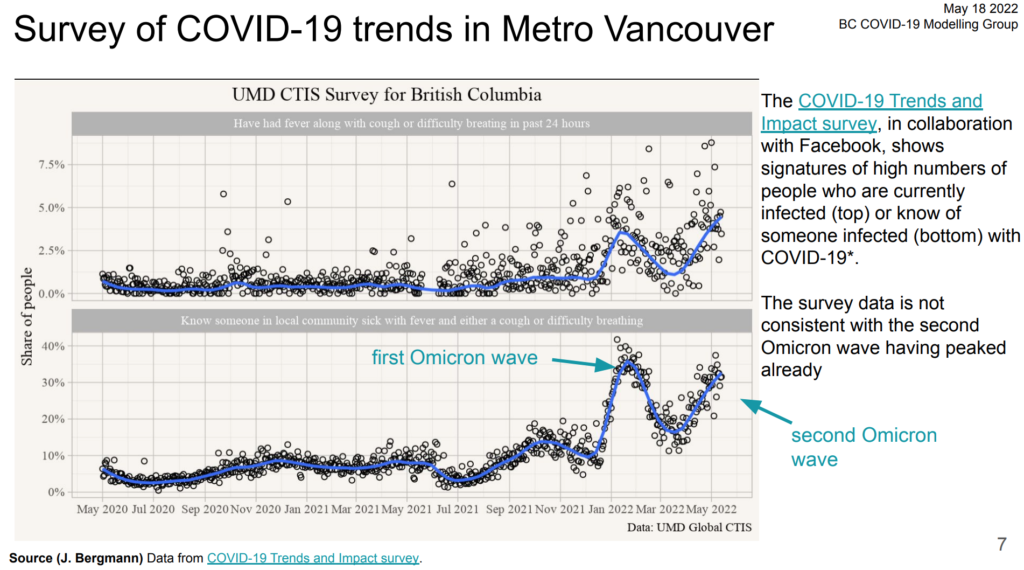
Another interesting set of data comes from the UMD Global COVID-19 Trends and Impacts Survey (done via Facebook). That isn’t totally scientific, but its past projections look reasonable, and it doesn’t show a decline AT ALL.
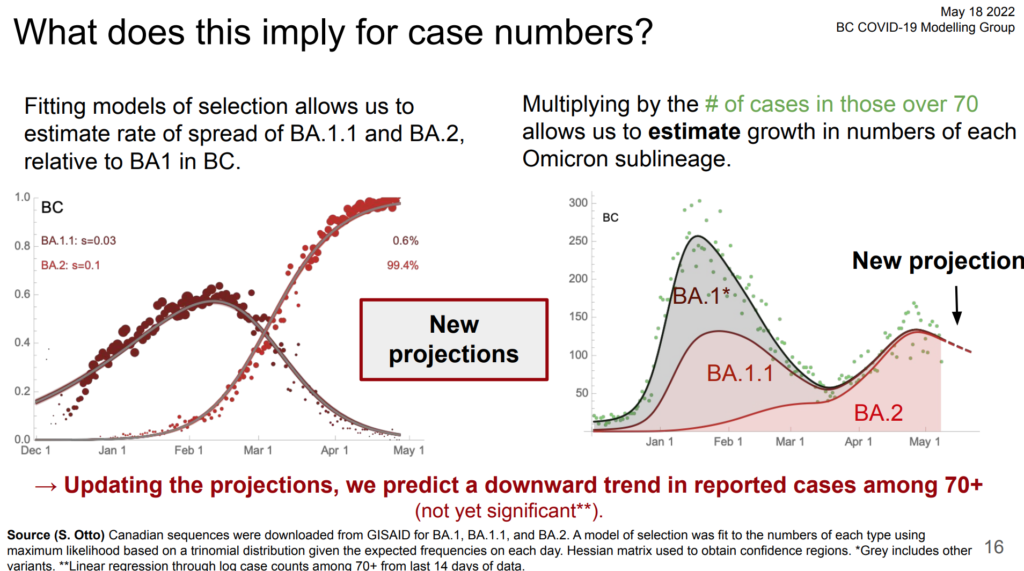
They also estimate the percentage which is BA.1.1 and how much is BA.2. From that, they made this chart, but I don’t understand how they went from “the percentage which is this even more transmissible is going up” to “total case counts are going to go down”. I guess they are basing thing on the case count in over-70s going down very slightly?
One thing I definitely agree with them on is that the data the province gives us is crap. (Uh, tbf, they didn’t actually say that quite so plainly…)
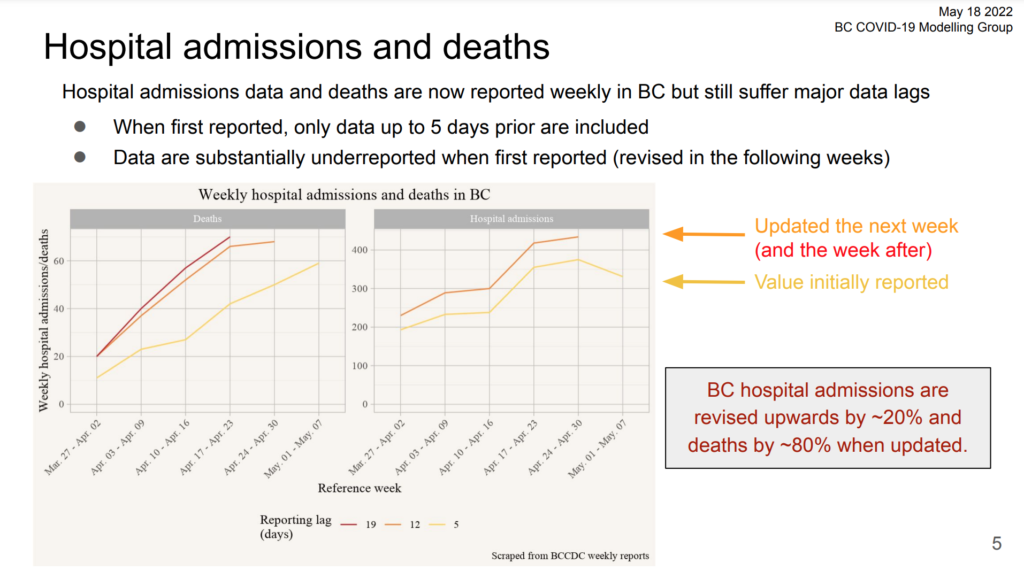
Today’s BC CDC weekly report says that the week ending on 14 May there were: +334 hospital admissions, +1,645 cases, +59 all-cause deaths.
Today’s weekly report says that last week (ending on 7 May) there were: +391 hospital admissions, +1,985 cases, +84 all-cause deaths.
Last week’s weekly report said that last week (ending on 7 May) there were: +331 hospital admissions, +1,987 cases, +59 all-cause deaths.
Charts
From the BC CDC situation report:


From the BC CDC weekly report:
