
Multiple Pathogens
Pathology
This paper from USA (2026-07-27) reports that children under six have a lot of asymptomatic infections and that infants under one year old are more vulnerable to illness than older children.
Among children in the study, all of whom were under six years old, these were the percent of illnesses which were asymptomatic:
- influenza: 7.6%, 14.5% for infants (under one year old);
- RSV: 10.2%, 12.5% for infants;
- Coronaviruses (including COVID-19) and adenoviruses: ~20%, 18.2% of infants;
- Rhinovirus/enterovirus and bocavirus: ~33%.
Infants were likely to get sicker than the older kids in the study:
- more likely to have respiratory distress/shortness of breath with
- influenza: 4.73 times more likely;
- RSV A: 2.52 times;
- RSV B: 2.22 times;
- metapneumonovirus: 2.36 times;
- COVID-19: 3.99 times;
Interestingly, infants were less likely to have respiratory distress than the older kids with influenza B (36% of the risk) or parainfluenza (10% of the risk).
COVID-19
Long COVID
💪 This paper from Netherlands (2026-07-28) reports that ME/CFS and Long COVID patients have different changes in their muscles than healthy people who were on strict bed rest for sixty days. (In other words, it’s not all in their heads, it’s not something they can “muscle through”!) Specifically, the bed rest cohort did have muscle atrophy, but the composition of their muscle fibres. The ME/CFS and Long COVID cohorts, however, lost more “slow twitch” muscle fibres than “fast twitch” fibres.
Vaccines
💉 This paper from USA (2026-07-24) reports that vaccination lowers the risk of Long COVID by 16%, and that it didn’t matter how long ago you got vaccinated (at least up to the seven month mark when their study concluded).
Pathology
🏥 This paper from Australia (2026-07-26) reports that people who catch COVID-19 in the hospital are more likely to die than people hospitalized for COVID-19 who caught it outside hospitals. This is somewhat understandable — the people who are in hospital are already sick with something else! However, this paper breaks down the risks pre- and post-Omicron. Before Omicron, people hospitalized with COVID-19 were about 4.5 times more likely to die if they caught it in hosptal compared to in the community; after Omicron hit, the risk of dying is only (“only!”) 1.62 times higher if you caught it in hospital.
Partly this has to do with demographics, however. People who caught COVID-19 in-hospital and in-community were approximately the same age (2.5 months different, on average) before Omicron. After Omicon hit, however, the average age of people who caught it in-hospital was 73.1 years old compared to 52.6 y/o who caught it in-community.
Challenge Studies
Two publications on two different challenge studies (where they deliberately infected healthy humans with SARS-CoV-2) just came out. I’m going to go into some detail here because I think these are important studies.
This preprint from UK (2026-07-27) reports the result of a challenge study done between May 2021 and April 2023 using COVID Classic as the infectious agent.
40 of 48 participants had already been vaccinated; the other eight were given a lower infectious dose. 46 of them had already had at least one COVID-19 infection.
56.2% tested positive for COVID-19 after they were inoculated, although 10.4% of them had very weak positives. 43.7% of them never showed any signs of getting sick.
Of the ones who had strong positives, the median time to a positive PCR test was about a day, and 63.5% of them only showed quantifiable illness for about 24 hours.
The last positive test, however, was on the 14th day after infection. That participant had an interesting history, giving a weak positive, negative, strong positive, negatives, strong positive, negatives, weak positive, negatives, and then the strong positive on Day 14. They might have kept going, but the study ended on Day 14. Some of the other participants had a strong positive, negatives, and then weak positives several days later, but none went from negative to strong positive.
🎉 Good news! They found correlates of protection! In other words, they were able to figure out what in the participants’ blood forecast how sick they were going to get. Participants with high levels of nasal IgG anti-spike and particularly receptor-binding domain antibodies correlated strongly with not getting sick.
This preprint from UK (2026-07-28) reports the result of a challenge study from November 2022 to June 2025 where they tried to infect participants with the Delta strain. For this study, they were trying to figure out what dose they needed to give people in order to get a 50% infection rate — by giving ever-increasing doses. All the participants had been vaccinated before the start of the study, and 83% reported a previous COVID-19 infection.
22/48 (45.8%) went through the first four doses without testing positive. The researchers started giving a round of an even higher dose, but after the first six participants still failed to get sick, they decided to do something else: they selected 18 people with lower levels of neutralizing antibodies in their blood from those 22 who didn’t get sick from the first four; they gave them an even bigger dose, with the goal of having half of them get sick. However, only a third (six) ever got a strong test result. (Another third had weak results or only tested positive on one day.)
Nobody got Long COVID (whew!).
For the people who tested positive, symptoms and timing was wildly variable.
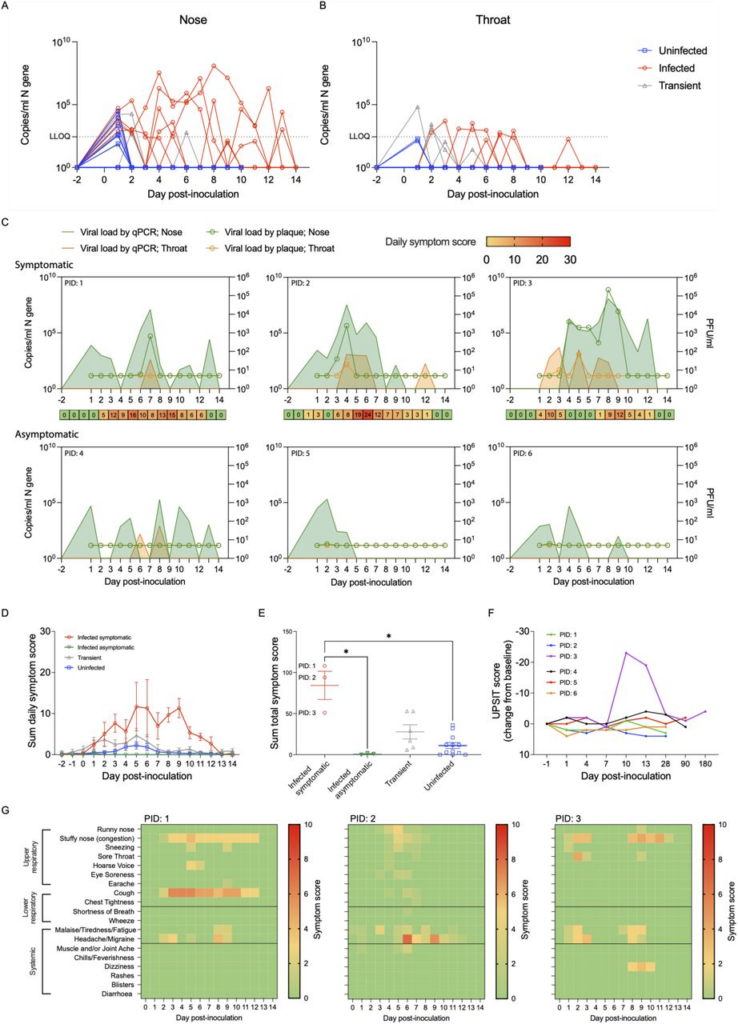
The text is kind of small, so I’ll describe some of it.
The top left graph (A) shows the amount of virus found in nasal swabs. Note that there are at least two participants who had significant viral load thirteen days after they got infected.
The top right graph (B) shows virus levels in throat swabs. Note that nasal swabs had a lot more virions than throat swabs.
The next six graphs (all part of C) shows the virus level by date for the six infected participants, broken out by symptomatic (the upper three subgraphs, for participants #1, #2, and #3) and asymptomatic (lower three subgraphs, for participants #4, #5, and #6). The three symptomatic participants’ subgraphs have colour coded “how-bad-are-the-symptoms” blocks underneath for the symptomatic people. Unsurprisingly, how bad the symptoms are roughly correlates with how much virus they have.
The next graph (D) shows how-bad-are-the-symptoms over time for pooled groups: symptomatic, asymptomatic testing positive, “transiently positive”, and people-testing-negative. Unsurprisingly, the badness of the symptoms gets lower for each of those pools. Surprisingly, even the people who always tested negative had a slight increase in badness-of-symptoms. Maybe they were getting bored with quarantine?
I didn’t think (E) was interesting; and (F) shows how bad people’s sense of smell was. Only participant #3 really had a change in smelling ability.
(G) shows how bad a bunch of specific symptoms were (e.g. cough, runny nose) for each of the three symptomatic participants. Note that participant #3 had symptoms on days 1-3 which resolved, but then came back on day #8.
🎉 They also had opinions about correlates of protection. Higher SARS-CoV-2 neutralizing antibodies, serum anti-Nucleocapsid IgG and nasal anti-Nucleocapsid IgG levels at baseline were associated with lower viral load and shorter infection duration. Nasal anti-Spike IgA was associated with a milder symptoms. Higher Nucleocapsid specific T cell response at baseline was also associated with lower viral loads.
BC Wastewater
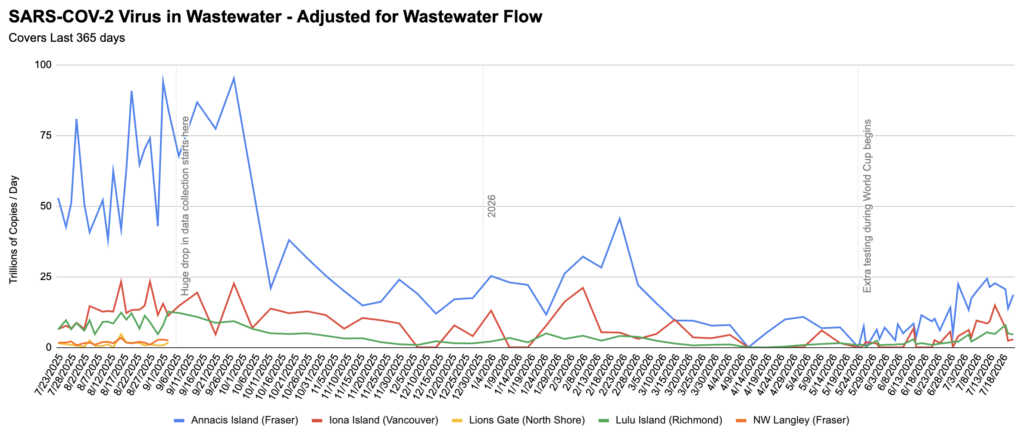
Well, that’s interesting. Wastewater levels have either plateaued or are going down slightly.
💩💧 From Jeff’s wastewater spreadsheet, with data through 2026-07-22:
Measles
Transmission
According to the Government of Canada Measles and Rubella Monitoring Report (updated 2026-07-27), in the week ending 18 July 2026, the following jurisdictions had the following number of new measles cases:
- Canada: 5;
- BC: 5.