Wastewater
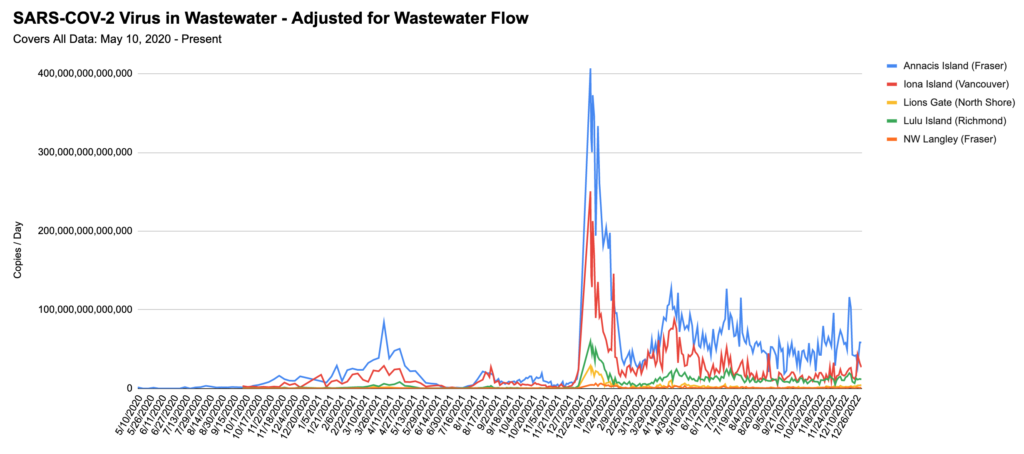
From Jeff’s spreadsheet, with data from MetroVan through 2 Jan:


There’s so much noise, it’s hard to tell if the amount of COVID-19 in the wastewater is going up or going down.
Non-COVID Respiratory Illnesses
I might not do any more reporting on non-COVID respiratory illnesses. The levels of illness are dropping pretty fast, and the worst of the hospitals’ crush — which affected COVID care — appears to be over. Anecdotally? I watch the BC Children’s Hospital emergency department wait times, and the last two times I’ve looked, the wait time has been a bit under an hour. It’s “normal-bad” now instead of “abnormal-bad”.
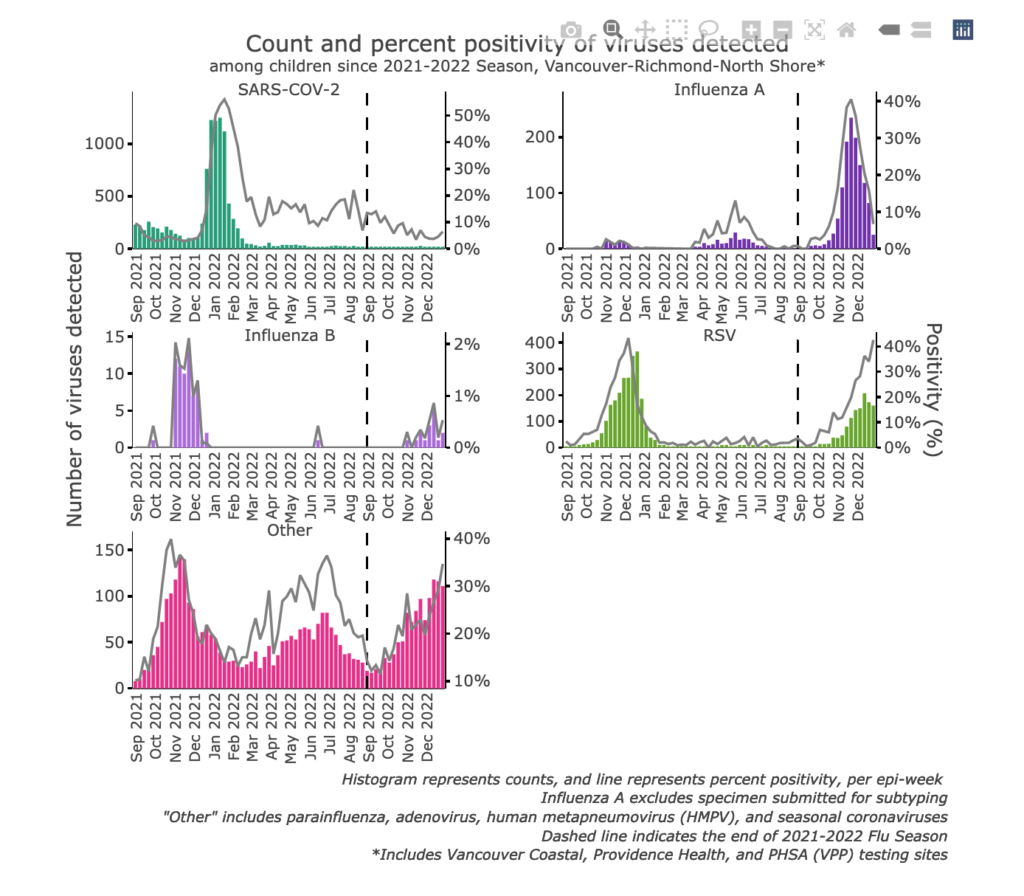
Graphs from the BC CDC Pathogen Characterization page, with data on Week 52 (through 31 Dec).
Adult influenza and entero/rhinovirus has plummeted, but RSV and “other” (parainfluenza, adenovirus, human meta pneumoniavirus, and “common cold” coronaviruses) are still increasing. Pay attention that the scales are very different: at their recent peaks, entero/rhinoviruses were at about 150 cases/week, flu was at about 1700, RSV is currently at about 750 (with last year’s peak at about 1400), and “other” is at about 200. Influenza is the most dangerous, so I’m happy that it has fallen so much from its peak (now at ~400 cases/week).

The children’s charts look pretty similar:

The graphs for Children’s Hospital in Vancouver look basically the same, I’m not going to bother to show it.
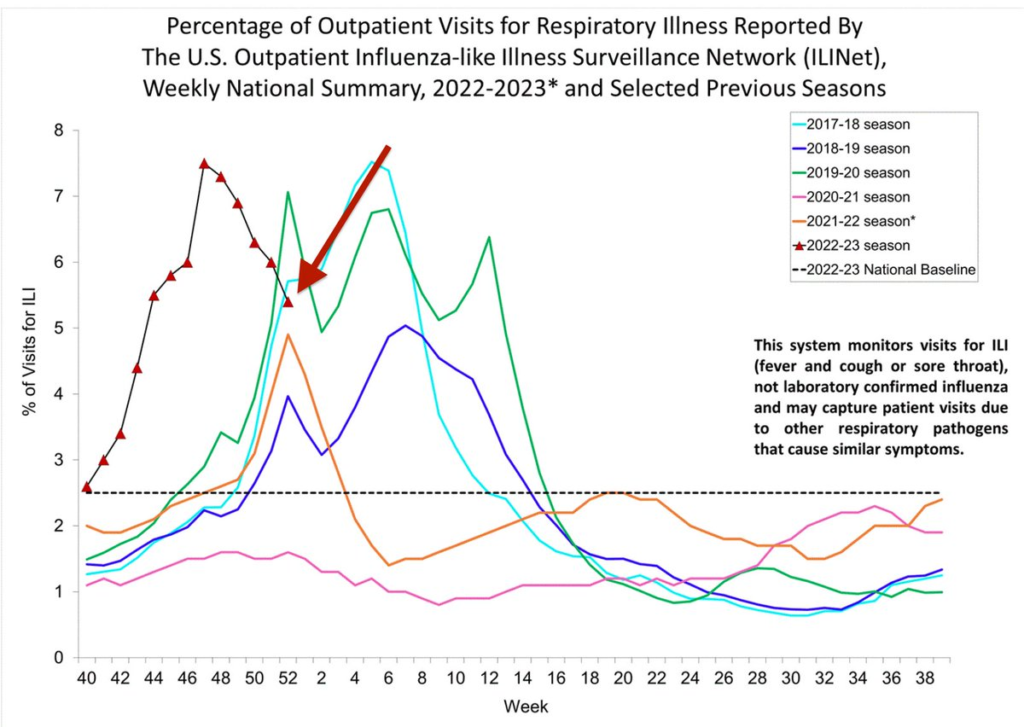
In the US, respiratory illness levels are definitely going down across the country, pretty dramatically. From the US CDC’s weekly FluView report, comparing this year’s respiratory illness levels to previous years:

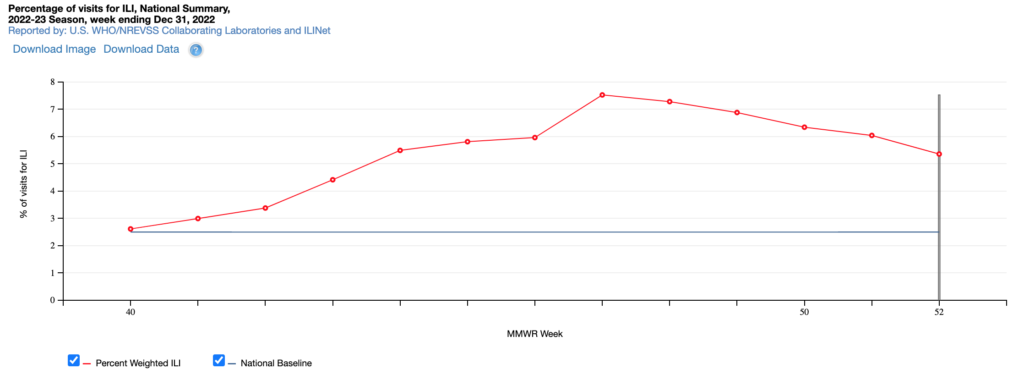
From the US CDC’s FluView Interactive (with data through 24 Dec), the US Pacific Northwest influenza level has also come down quickly:

In the US Pacific Northwest, the levels of all upper respiratory diseases has gone down, but not as dramatically as influenza fell:

