There are several charts with come out on Fridays, so I will make this tiny little stub of a blog post just for those charts.
Charts
From my buddy Jeff (who says that yes he collects manually, but it’s cut and paste so unlikely to be numerically incorrect)’s Google Sheet:
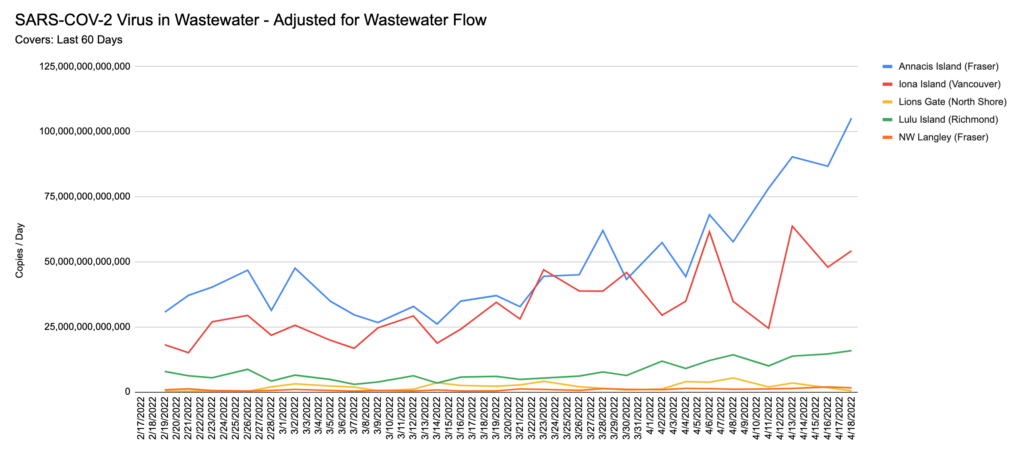
See also the Lower Mainland Wastewater Twitter bot if you don’t like Jeff’s charts. Or check Justin McElroy’s Twitter feed also — he usually posts a wastewater chart some time on Fridays.
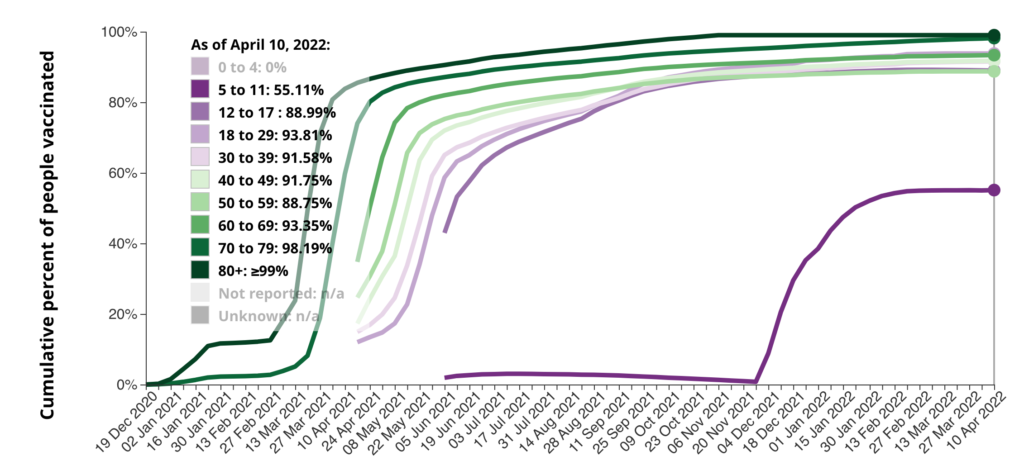
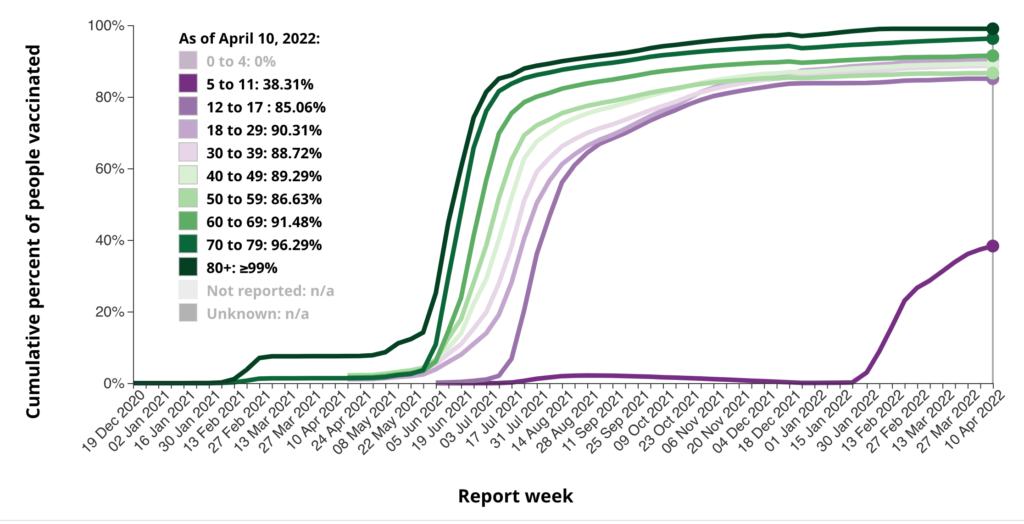
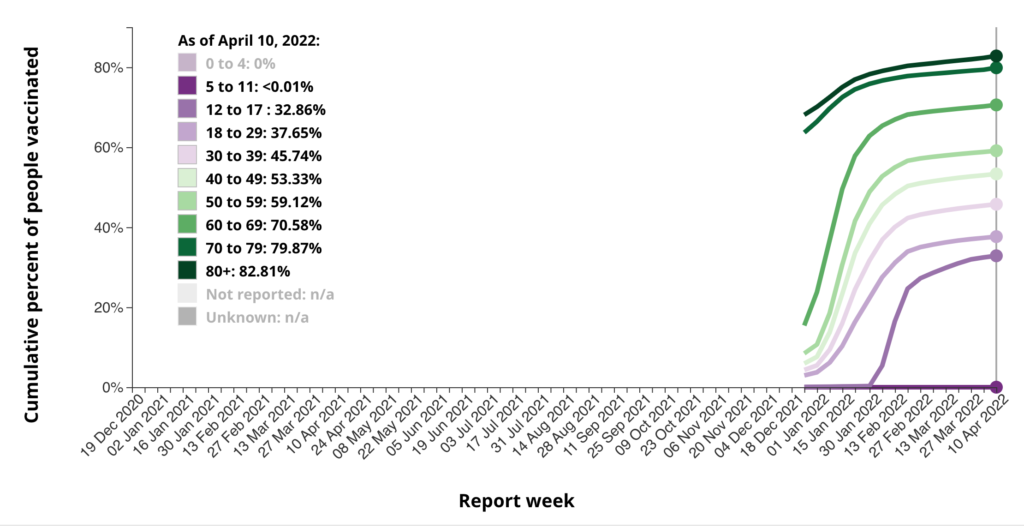
The vax charts I published yesterday were six days old. Here’s the ones which were published today. From the federal vax page, vax uptake by age over time for British Columbia, doses 1, 2, and 3: