This week’s postings will be short because I have Things To Do for the next few days. This means that the wastewater information will be delayed. I might revise this blog on Friday or Saturday to add in the wastewater chart, but otherwise you’ll need to wait a week.
Charts
From the Viral Pathogen Characterization page:
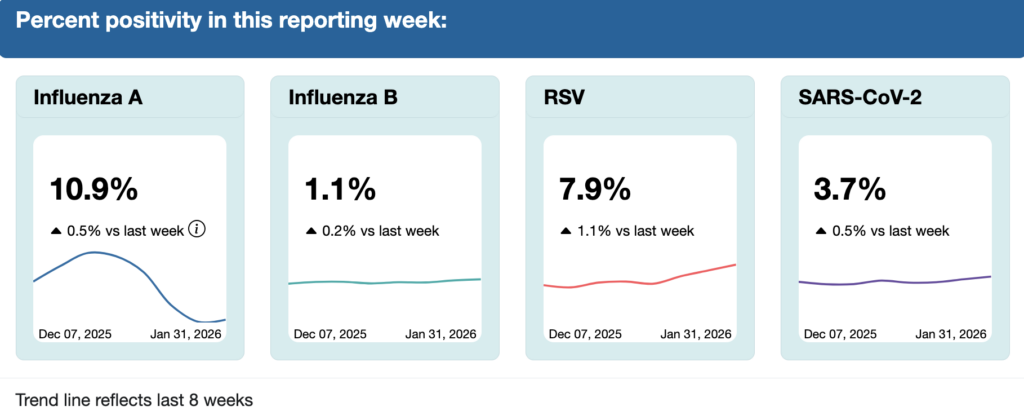
All the pathogens’ levels seem to be in a bit of a holding pattern. This season is turning out to be a relatively “easy” winter, knock wood.
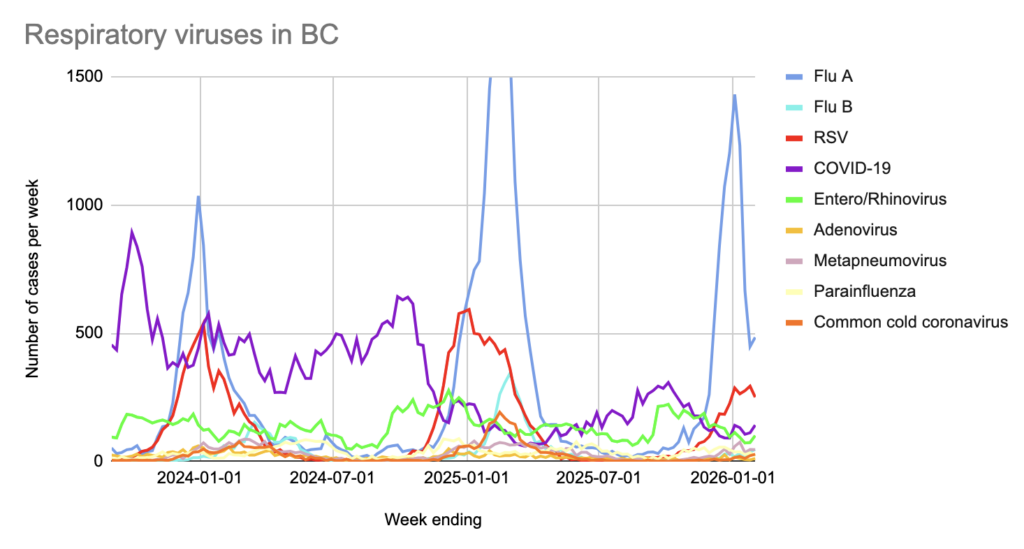
In the most recent data (ending 31 Jan 2026) as reported on 5 Feb 2026, among influenza-like illness (i.e respiratory diseases) cases that the province has test data for:
- 46.9% were influenza A or B;
- 22.2% were RSV;
- 12.5% were COVID-19;
- 8.9% were entero/rhinoviruses;
- 4.1% were metapneumonia viruses;
- 2.5% were “common cold” coronaviruses;
- 1.9% were parainfluenza;
- 1.1% were adenoviruses.
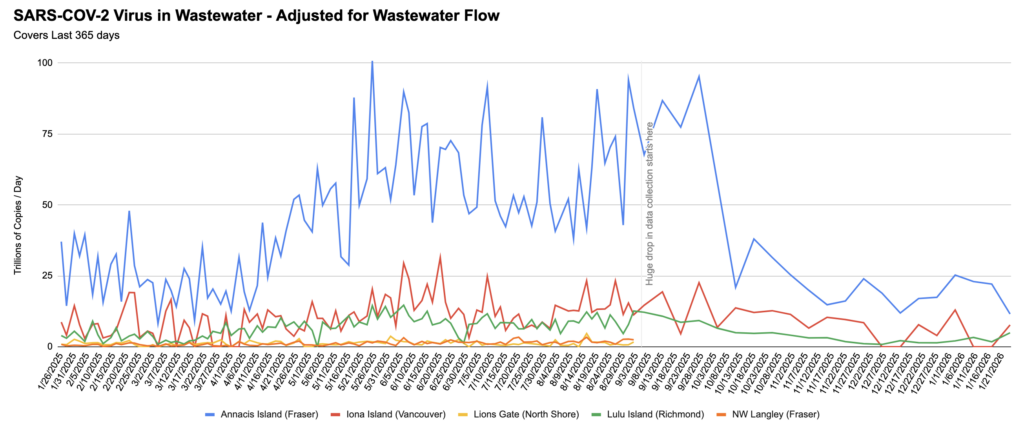
Wastewater
💧💩 From Jeff’s wastewater spreadsheet: