Yay! Something at the very end of this article (2025-01-17) on what the BC teen with bird flu went through says that she’s out of the hospital and back home. 🎉
Health Care System
This report (2025-01-16) reports that an estimated 28,077 Canadians died while waiting for surgery or diagnostic tests between April 1, 2023 and March 31, 2024.
From the provincial Freedom of Information requests listed in the above report, these are the number of people in each Health Authority who died while awaiting service.
| Health Authority | Surgery | Diagn’stic | Total | Per 1000 |
| Interior | 212 | 1232 | 1444 | 1.76 |
| Fraser | 230 | 1343 | 1573 | 0.80 |
| Northern | 73 | 105 | 178 | 0.59 |
| Van Coastal | 256 | 488 | 744 | 0.60 |
| Island | 217 | 306 | 523 | 0.60 |
| Total | 988 | 3474 | 4462 | 0.86 |
Note that not all surgeries or diagnostics were related to the deaths. For example, if someone was waiting for a mammogram and got hit by a bus, that would count in these statistics. I don’t have a way of knowing how many deaths were caused by a delay.
Charts
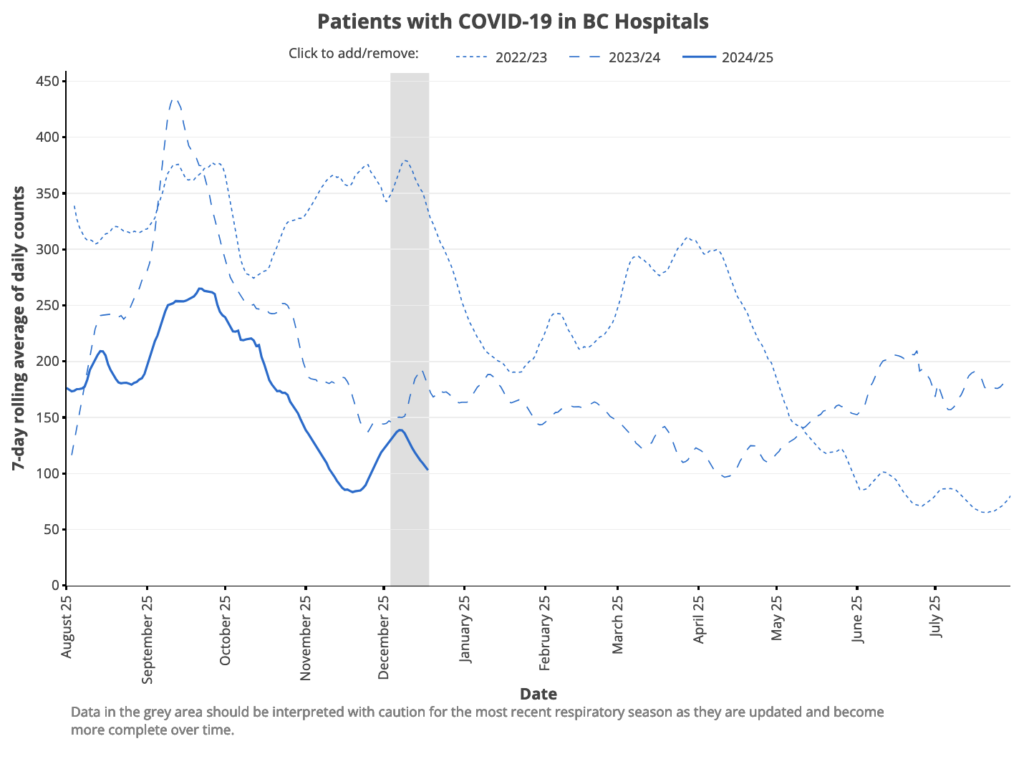
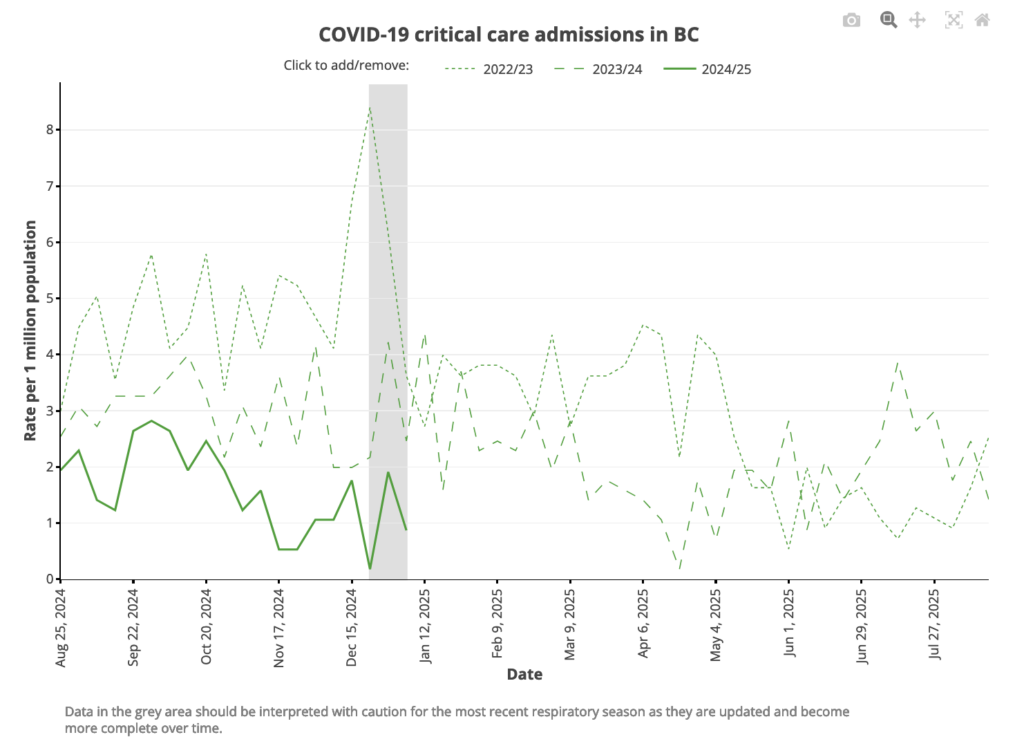
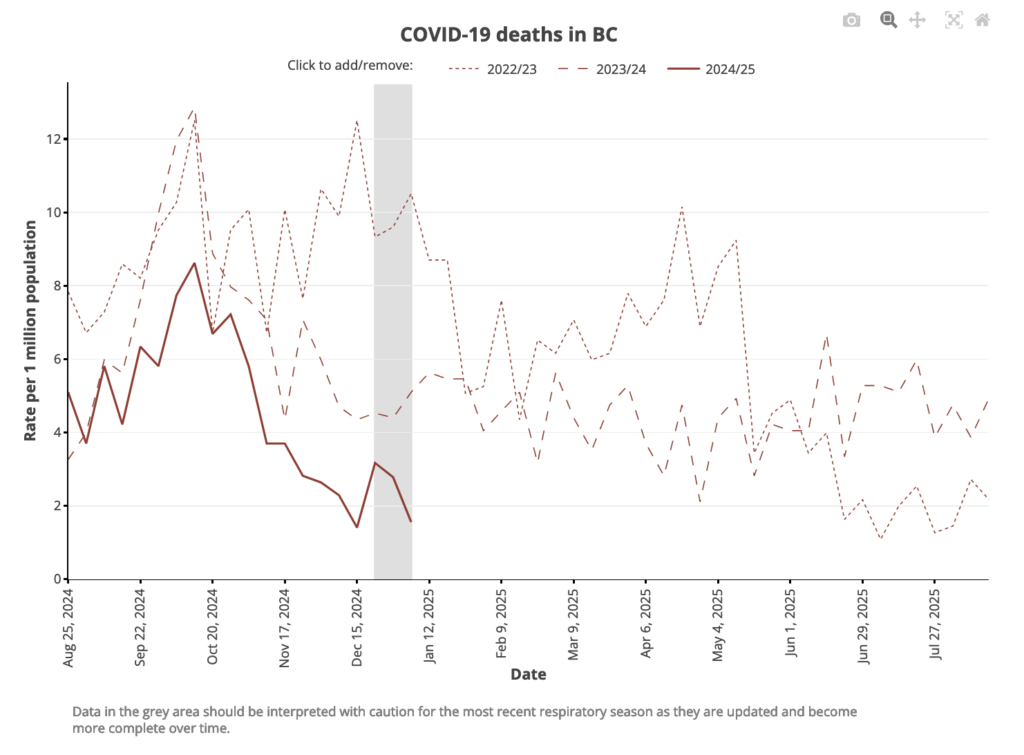
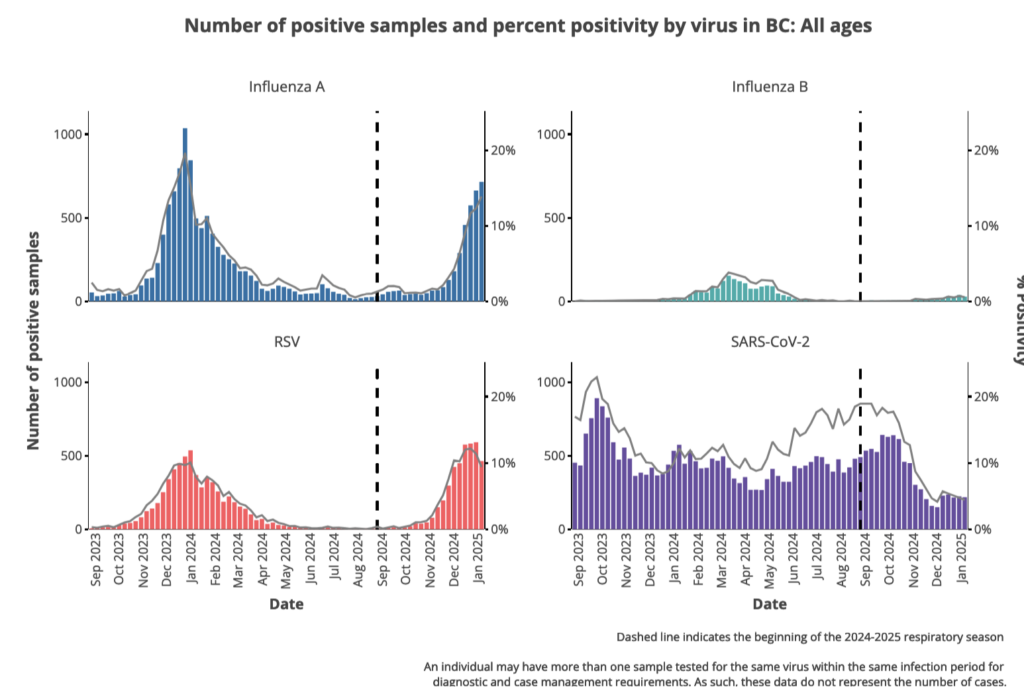
From the BC CDC Situation Report:

Comparison vs. Other Influenza-Like-Illnesses, from the Viral Pathogen Characterization page:
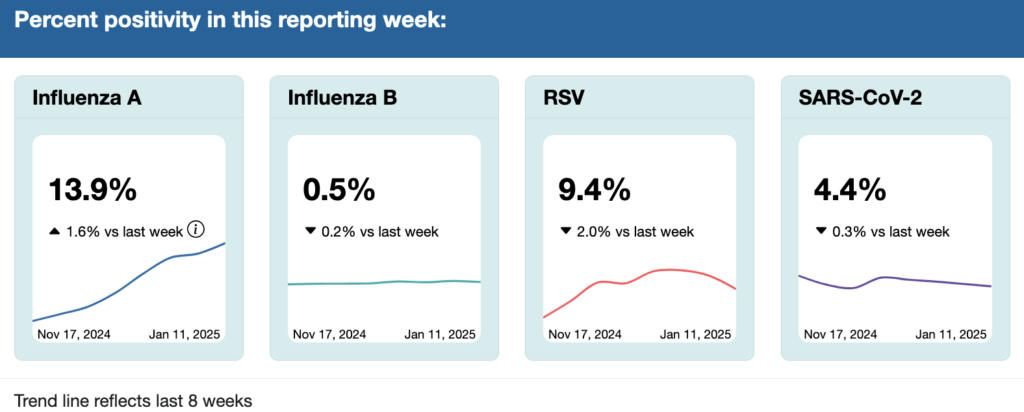
Flu is still going up, but its rate of increase has slowed quite a bit. It looks to me like we’re near the peak. I think we’re past the RSV peak. COVID-19 has been stable. It doesn’t show on the charts, but entero/rhinoviruses are down by about a third.
In the most recent week with full data (ending 4 January) as reported on 16 Jan 2025, among confirmed cases, there were:
- 32% as many COVID-19 cases as flu cases,
- 38% as many COVID-19 cases as RSV cases,
- about 33% more COVID-19 cases as enterovirus/rhinovirus cases.
- only about 13% as many COVID-19 cases as all the other influenza-like illnesses (influenza, RSV, enterovirus, rhinovirus, adenovirus, human metapneumovirus, parainfluenza, and common-cold coronaviruses) combined.
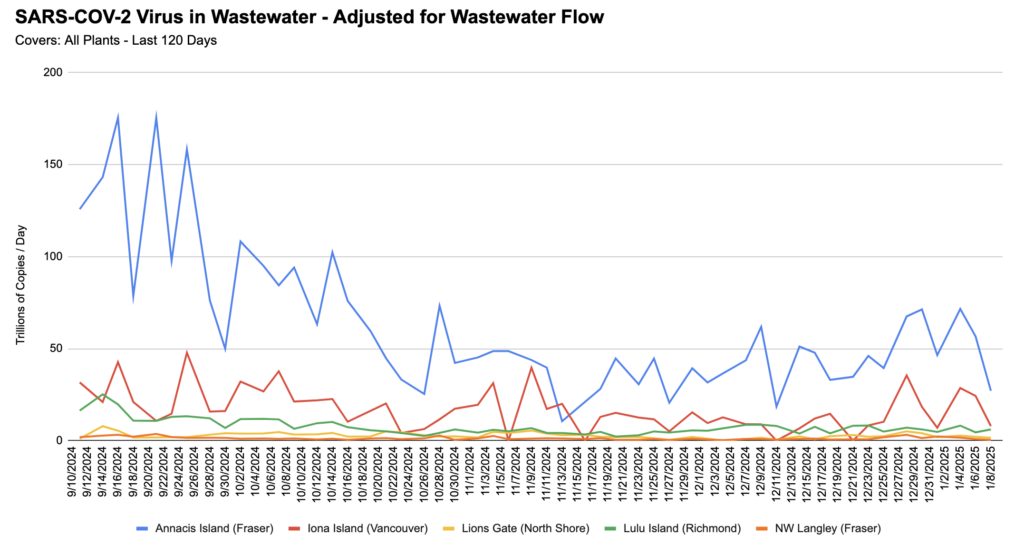
Wastewater
From Jeff’s wastewater spreadsheet: