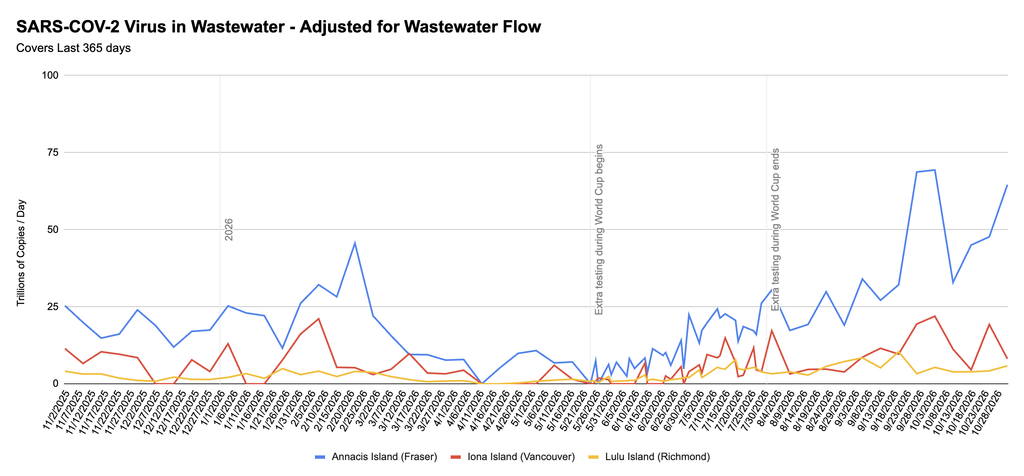
Wastewater sure looks like it’s going up. All other provincial data is suspect, see below.
Charts
The Viral Respiratory Outcomes page has a note that it didn’t get updated this week, and will be updated next week. 🙁
Meanwhile, the Viral Pathogen Characterization page has this notice: “Testing data is currently incomplete in some regions due to recent changes in data reporting processes. Results from recent reporting weeks should be interpreted with caution.”
I don’t know if that notice was on there last week and my eyes just skipped over it, or if it is new this week. I have definitely noticed that the data adjustment after a week (or sometimes two) is large. For example, two weeks ago, the province said that there were 648 cases of flu A in the week ending on Halloween; this week they say that there were 761 flu A cases in that week — 113 (17%) more! I’m not sure I can say anything intelligent given how inaccurate the province’s “this week” numbers are.
Maybe I should just leave off the current week’s data, and only show graphs and figures up through two weeks ago. Sigh.
What the flawed data this week says about the week of 7 November, as reported on 12 November:
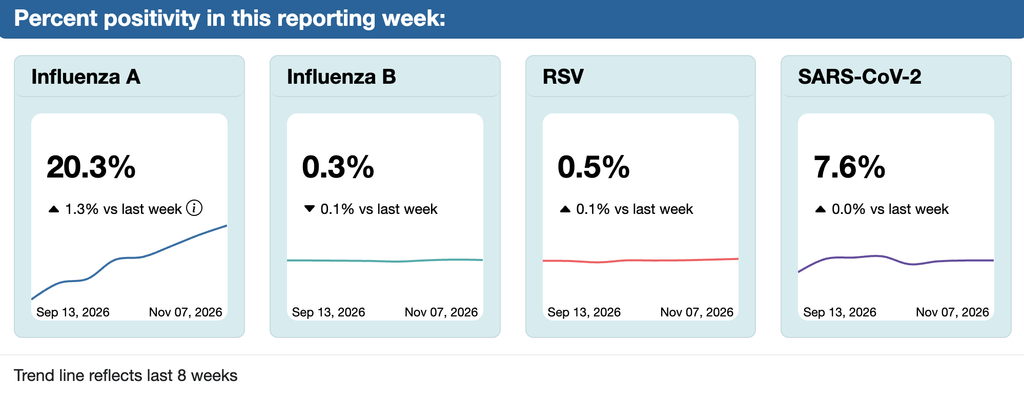
There was an unusually large drop this week in the case counts for all of the respiratory viruses, so I don’t believe them. Still, this is what we have so far. The data from two weeks ago is probably pretty close; the data from three weeks ago is probably as accurate as your eyeball can tell:
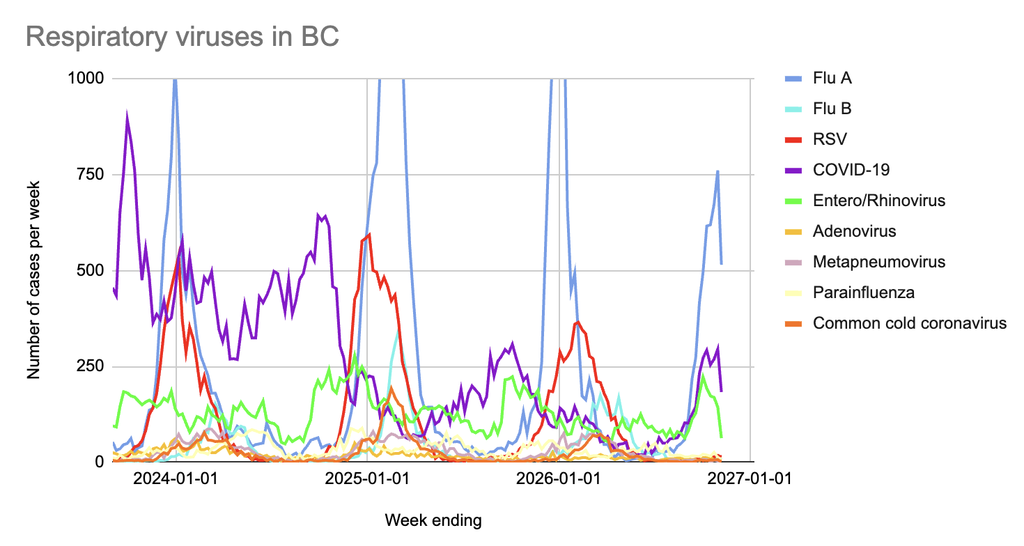
In the most recent (presumably flawed, sigh) data, among respiratory virus cases that the province has test data for:
- 64.7% were influenza A or B (almost exclusively A);
- 23.0% were COVID-19;
- 7.9% were entero/rhinoviruses;
- 1.8% were RSV;
- 1.0% were parainfluenza;
- 0.6% were adenoviruses;
- 0.1% were “common cold” coronaviruses;
- 0.9% were metapneumonia viruses.
Wastewater
💩💧 Here’s the past-year graph from Jeff’s wastewater spreadsheet, with data through 1 November 2026: