Charts
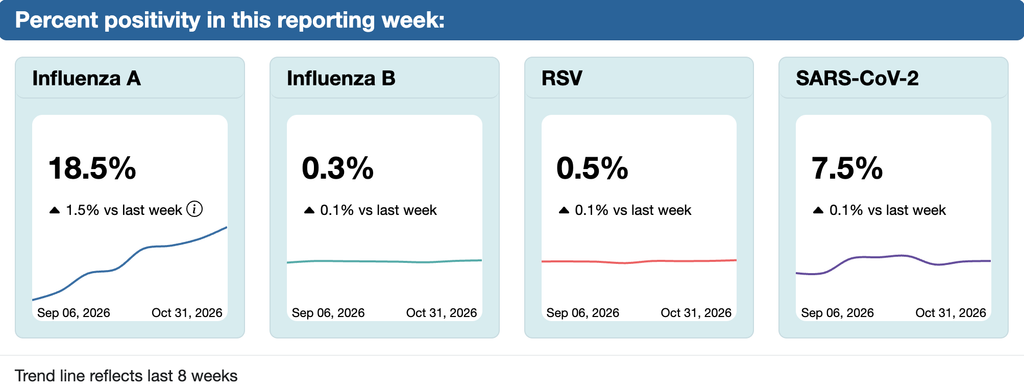
From the Viral Respiratory Outcomes page (updated 5 November 2026 with data through 31 October):
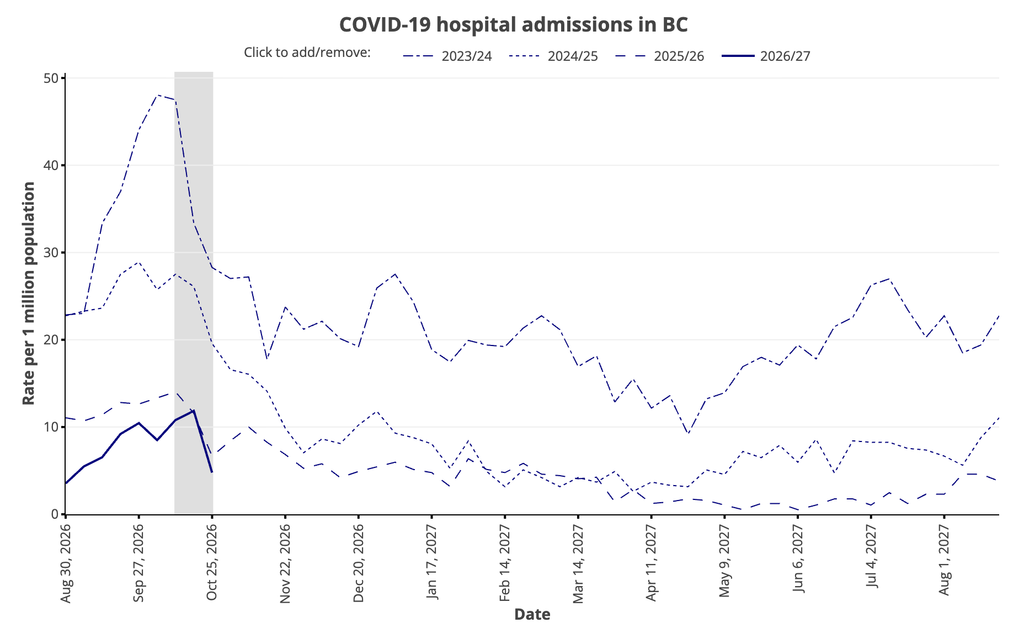
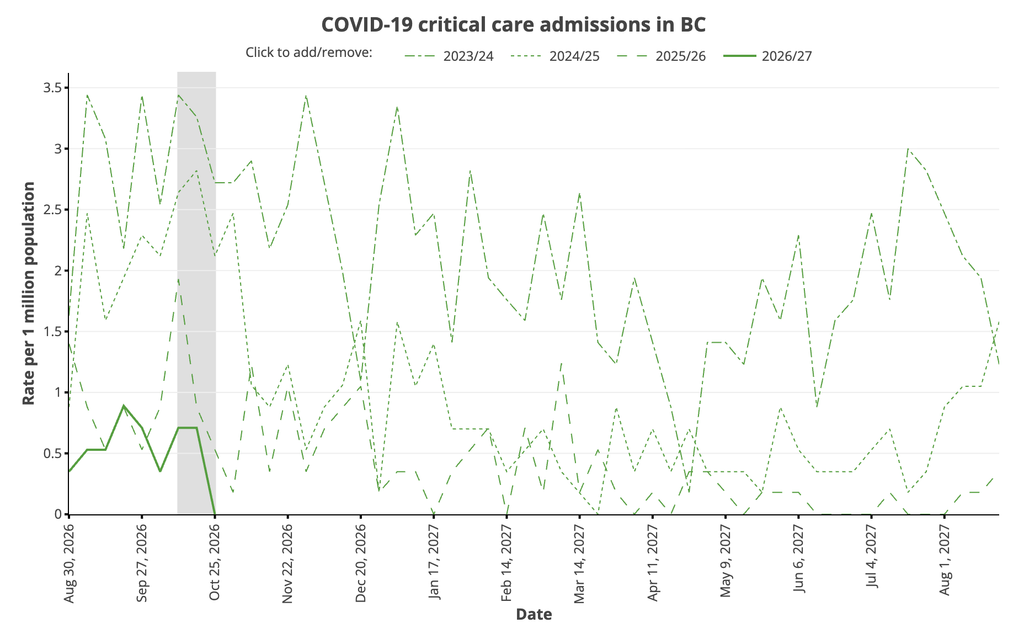
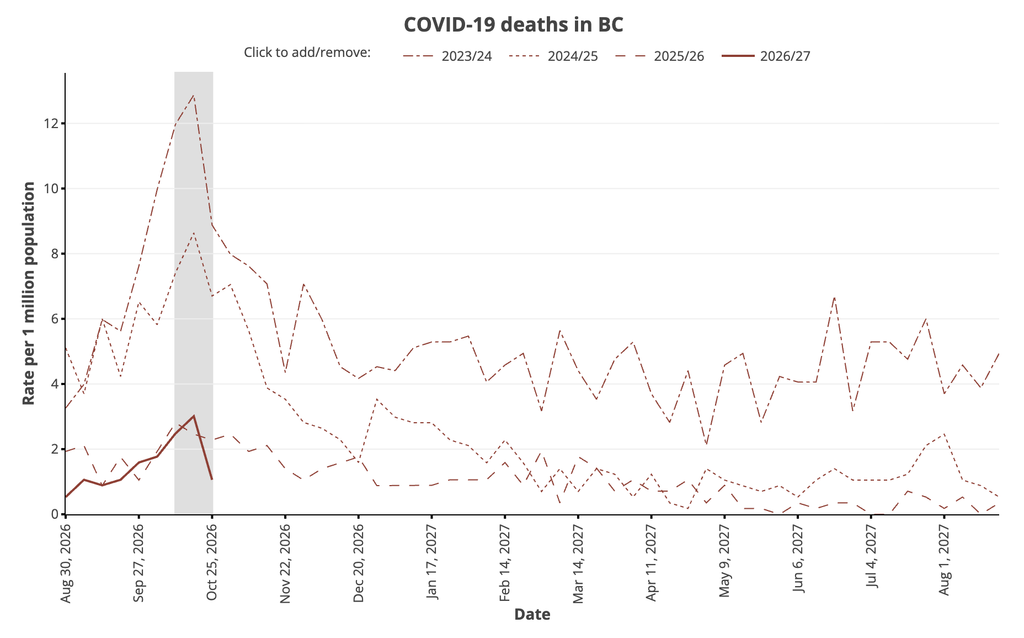
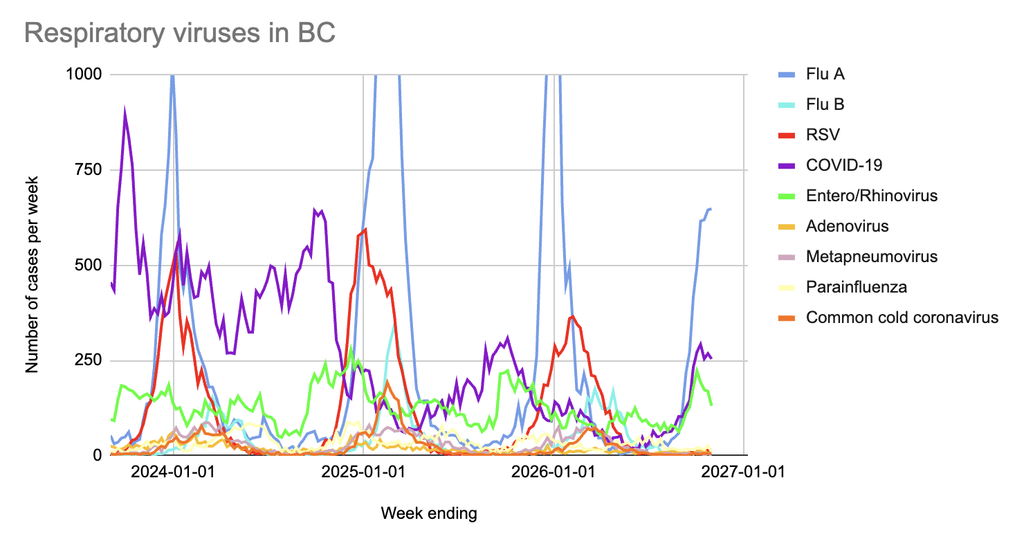
From the Viral Pathogen Characterization page with data up to 31 October, as reported on 5 November:
A given week’s flu numbers have been getting incremented by on the order of 40-60 cases after a week or two, but the COVID-19 cases only get incremented by order of 5-10 later. (I don’t know why the province is slower to record flu cases than COVID-19 cases.) Still, even if I add order of 50 cases to this week’s flu numbers, it seems like flu’s rise is slowing down a bit.
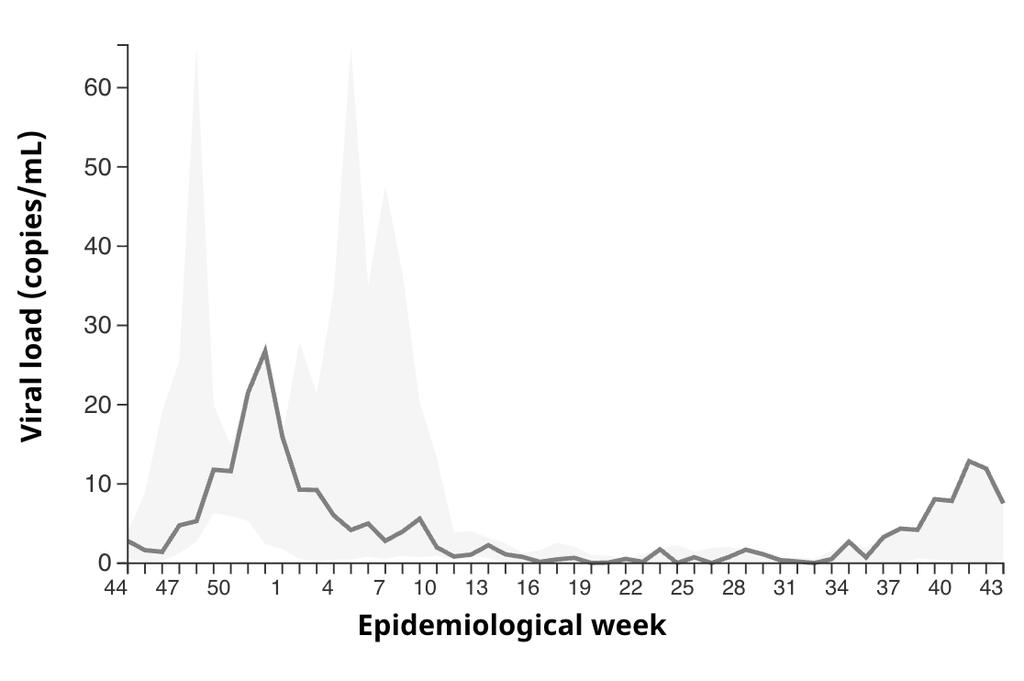
Meanwhile, the federal wastewater graph for influenza in BC looks like flu is going down:
In Canada overall, however, flu is still going up. I suspect that with such an early appearance of the flu, we’ll see a second bump a little later.
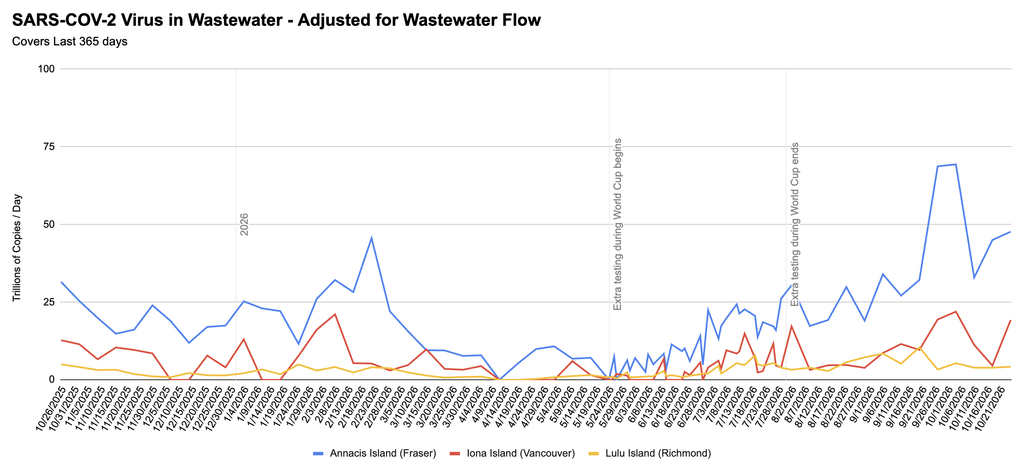
For COVID-19, case counts look flattish, but wastewater sure looks to me like it’s still going up.
In the most recent data, among respiratory virus cases that the province has test data for:
- 60.8% were influenza A or B (almost exclusively A);
- 23.4% were COVID-19;
- 12.1% were entero/rhinoviruses;
- 1.5% were RSV;
- 0.9% were parainfluenza;
- 0.6% were adenoviruses;
- 0.6% were “common cold” coronaviruses;
- 0.1% were metapneumonia viruses.
Wastewater
💩💧 Here’s the past-year graph from Jeff’s wastewater spreadsheet, with data through 25 October 2026: