Health Care System
😡 In last week’s post (2026-10-24), I talked about how the province was squeezing group Long COVID sessions so hard that they would probably cease to exist. A friend of mine who has contacts in the Long COVID community, suspects that the province’s motivation is to keep people from going on disability. Apparently, one of the things that these group sessions do a lot of is help people navigate the f bureaucracy paperwork. If the group sessions don’t exist, the people don’t get help filing for disability payments, so they don’t end up on disability, so the province doesn’t have to pay disability payments.
Not only does that save the province money, but it makes the health care system look better than it is at keeping people healthy and fully functional.
Charts
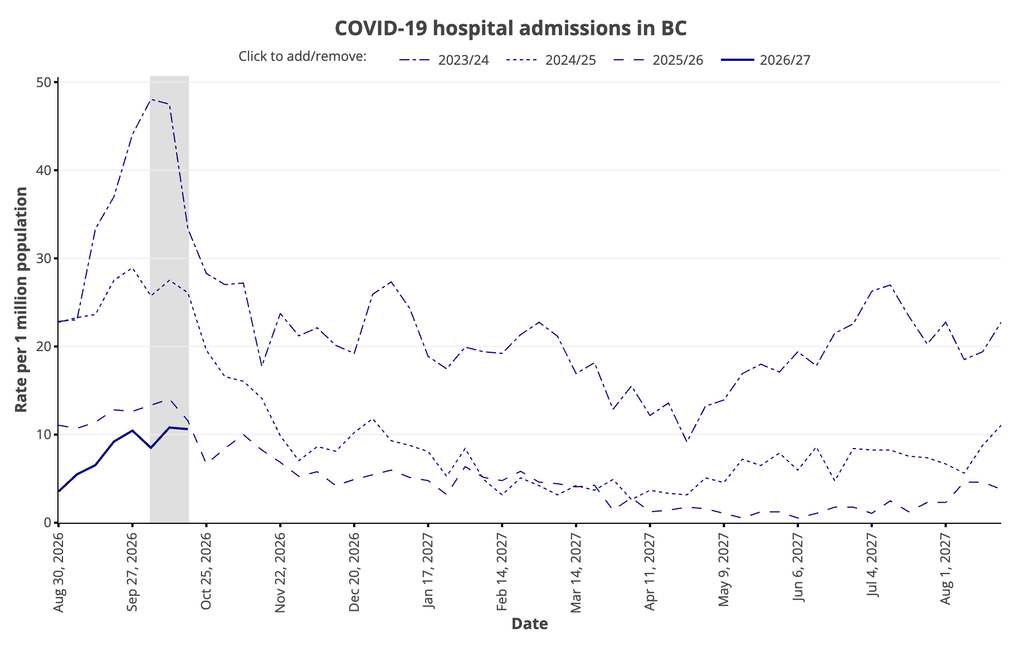
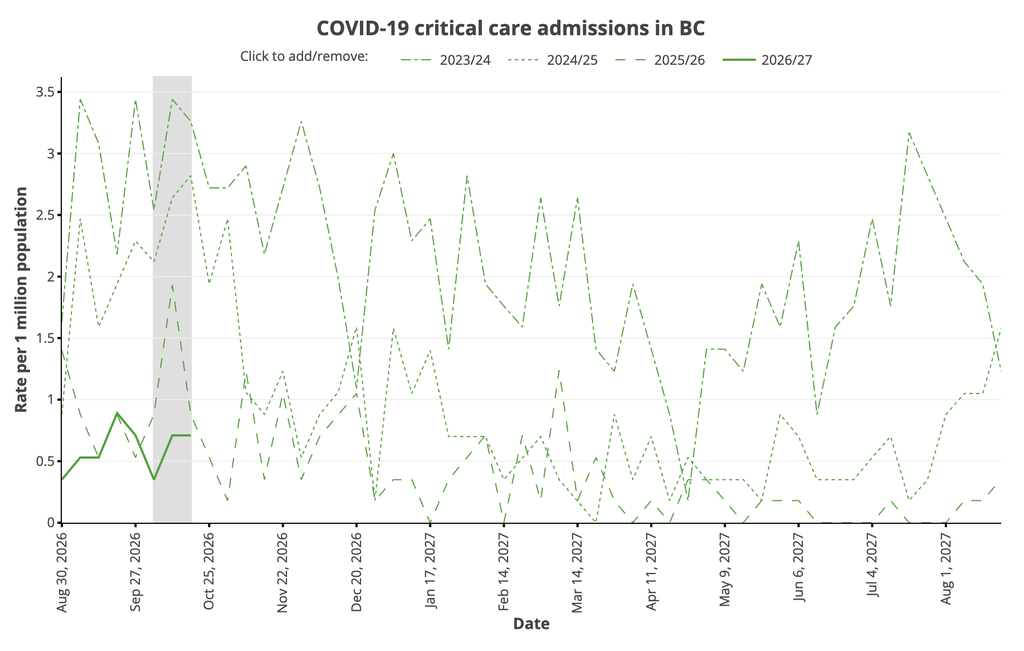
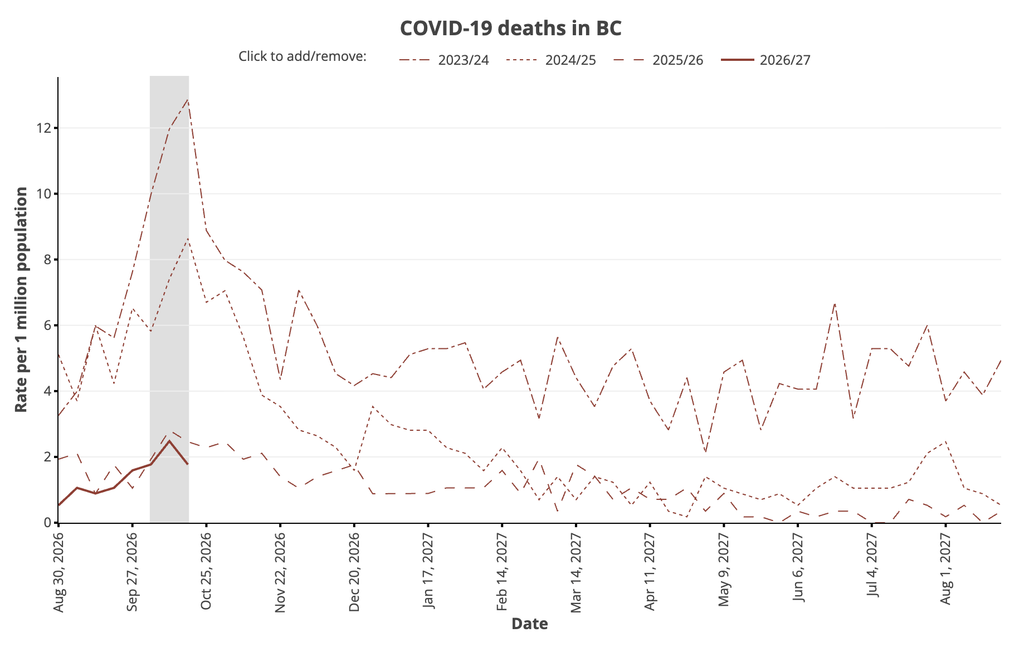
From the Viral Respiratory Outcomes page (updated 29 October 2026 with data through 24 October):
From the Viral Pathogen Characterization page with data up to 24 October, as reported on 29 October:
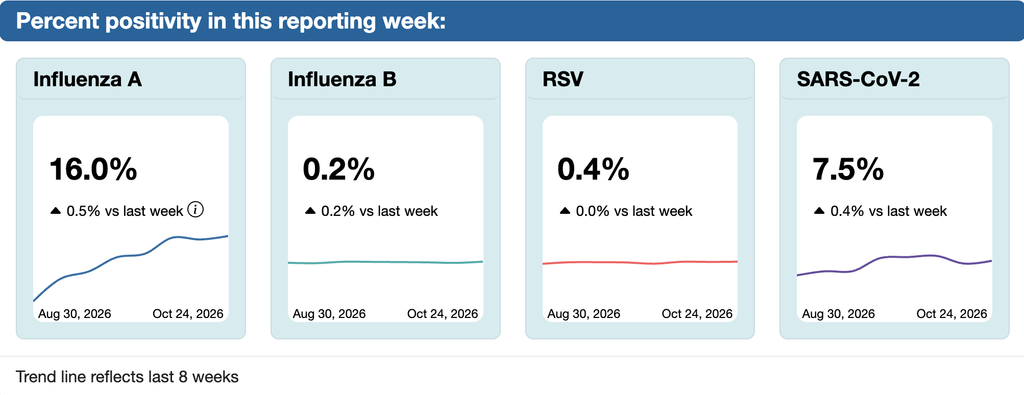
It’s always hard to tell if a downtick is a real downtick or if it’s just that not all the data has come in yet. This week, flu, COVID-19, and rhinovirus all show shows a downturn for two weeks in a row, and flu and COVID-19 had really really minor upticks — within the noise levels — so maybe the downturn is real. Or maybe it was just that the weather was nice-ish the week of October 17th, so people didn’t get sick much that week? (2026-11-01 Ed: sorry, I apparently used the wrong graph at first so was confused!)
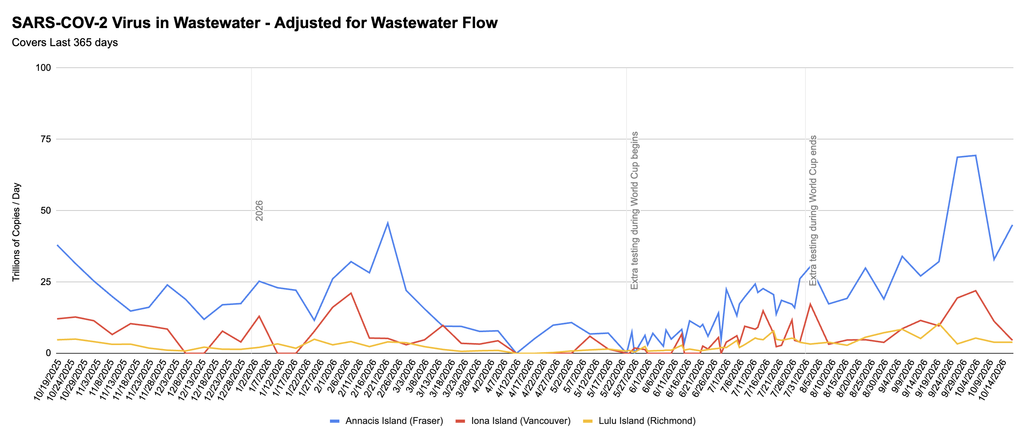
The wastewater — which lags behind the case data by a week — seems like it’s still going up in Fraser but down in Vancouver (and flat in Richmond) — isn’t any help at clarifying what is going on.
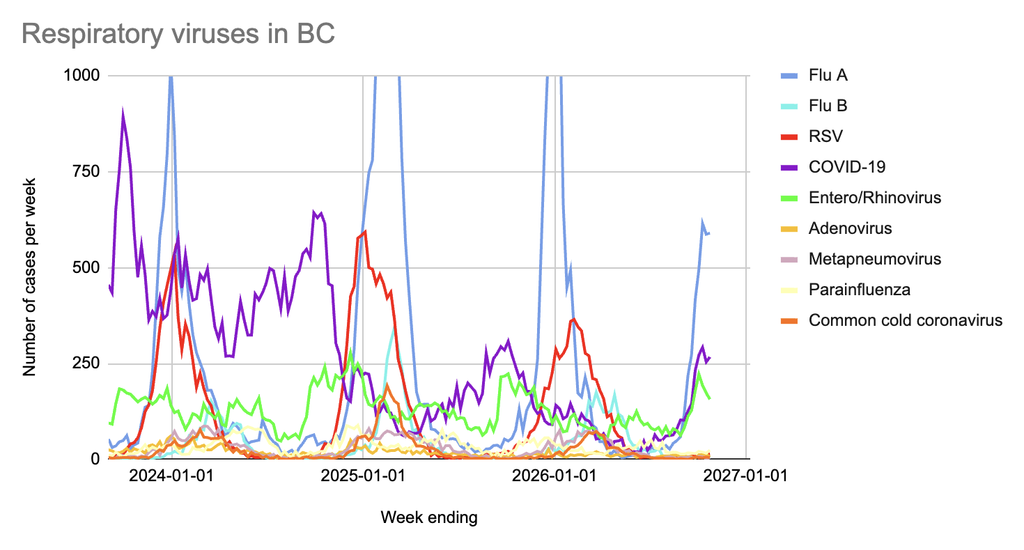
In the most recent data, among respiratory virus cases that the province has test data for:
- 55.6% were influenza A or B (almost exclusively A);
- 24.8% were COVID-19;
- 14.6% were entero/rhinoviruses;
- 2.2% were parainfluenza;
- 1.3% were RSV;
- 0.6% were adenoviruses;
- 0.5% were “common cold” coronaviruses;
- 0.5% were metapneumonia viruses.
Wastewater
💩💧 Here’s the past-year graph from Jeff’s wastewater spreadsheet, with data through 18 October 2026: