
The province says this is the last weekly data update until Fall (except for wastewater). The Viral Respiratory Outcomes page and the Pathogen Characterization pages will be updated on the first Thursday of the month.
Vaccines
I have gotten mixed messages about the Spring COVID-19 vaccinations. A friend of mine in Fraser who is over 70 said that his pharmacy called him and said that the province wasn’t using the reservation system; the provinces were leaving it up to the pharmacy.
HOWEVER, someone else in Fraser said that their pharmacy told them that they had to use the reservation system. I called my pharmacy (an independent one in VCH) and they said that the reservation system was in use but that they are taking walk-ins.
My pharmacy also said that even if you are not in one of the groups explicitly called out, you are still allowed to get a shot (as long as it has been at least three months since your previous shot).
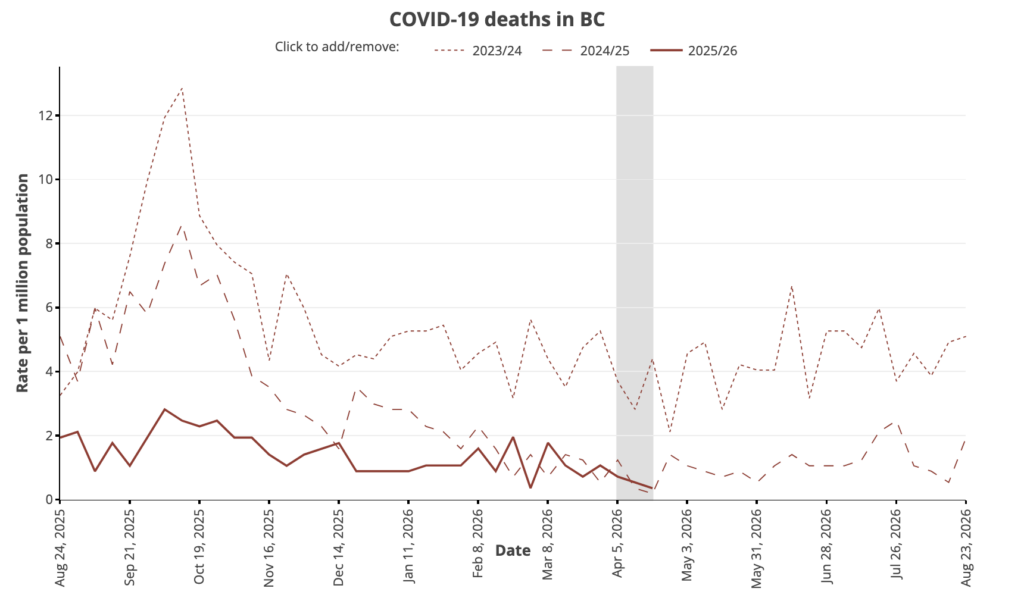
Someone asked me if they should get a COVID-19 booster right now. I am not an epidemiologist, a doctor, or a psychic. I don’t know what’s going to happen in the next few months. However, COVID-19 levels look really really low right now, and in the past three years there has been a gradual rise from April or May through to early-to-mid October, while the Fall vaccine campaign usually starts around 10 October. So if you get your booster right now, you will have good protection while COVID-19 is low, and poor protection by the time it has historically peaked.
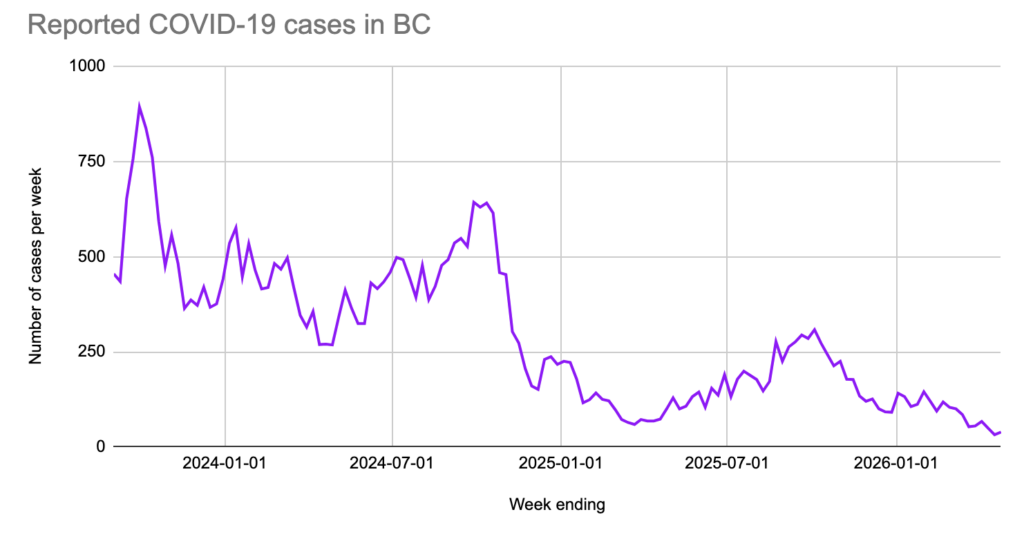
Something that I wondered about was whether the Fall vaccination campaign causes the fall in cases that starts in October. I crunched some data, and the tl;dr: is that it might account for some of the drop, but can’t account for it all. Something else is going on, and I don’t have a clue what it is.
Boring data crunching (you can skip this)
To try to answer the question of why levels fall in October, I looked at vaccination coverage, but could only find limited data:
- this press release (2026-10-22) says that 215,000 people (about 4% of the BC population) were vaccinated for COVID-19 in the first two weeks of the Fall 2025 campaign;
- this table shows archived provincial data by age, usually only for elderly:
| Season | % all ages | % 65-79 | % over 80 |
| Spring 2025 | 23.1% | 31.9% | |
| Fall 2024 | 44.8% | 52.9% | |
| Spring 2024 | 28.3% | 35.8% | |
| Fall 2023 | 26.7% | 53.8% | 59.0% |
| Spring 2023* | 36.8% (70-79) | 38.9% |
I couldn’t find data for BC on what percent of cases are over 65, but for Canada overall, it’s about 60% according to this page:
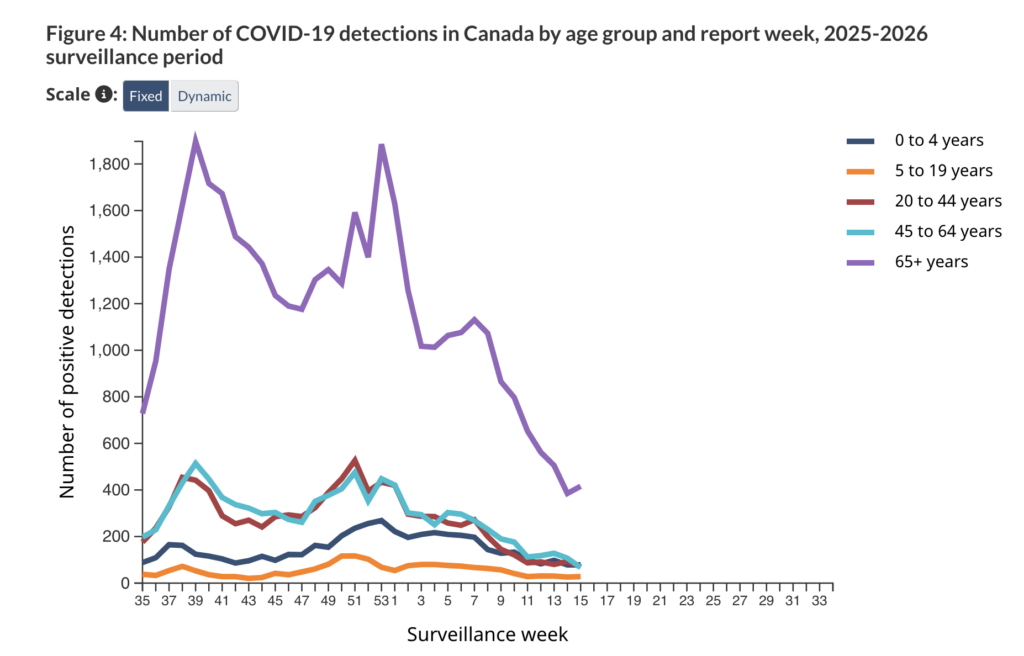
If we assumed (very conservatively!) that all of the cases came from people over 65 (who get most of the vaccinations!), then that would mean we’d expect to see a fall in cases due to vaccinations of (very roughly!) around half after October, since (very roughly!) half of the over-65s get vaccinated in the fall.
However, in 2024, the number of cases fell about 76% from the October peak to the first week of December; in 2023 and 2025 the drop was about 60%. That’s more than could be accounted for if the entire population was as vaccinated as the over-65s.
Charts
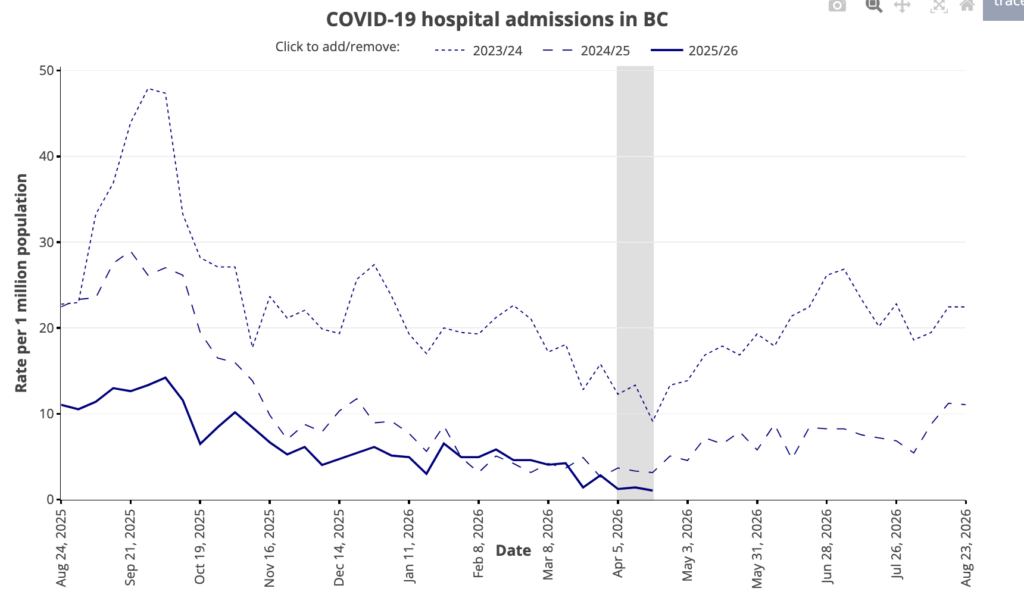
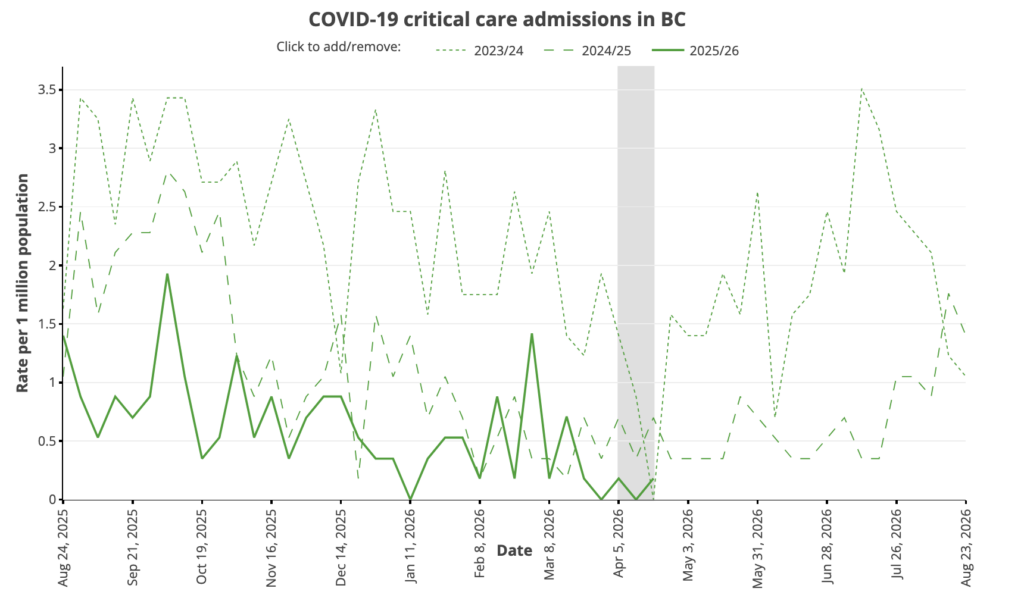
From the Viral Respiratory Outcomes page (updated 30 April 2026 with data through 25 April):
From the Viral Pathogen Characterization page:
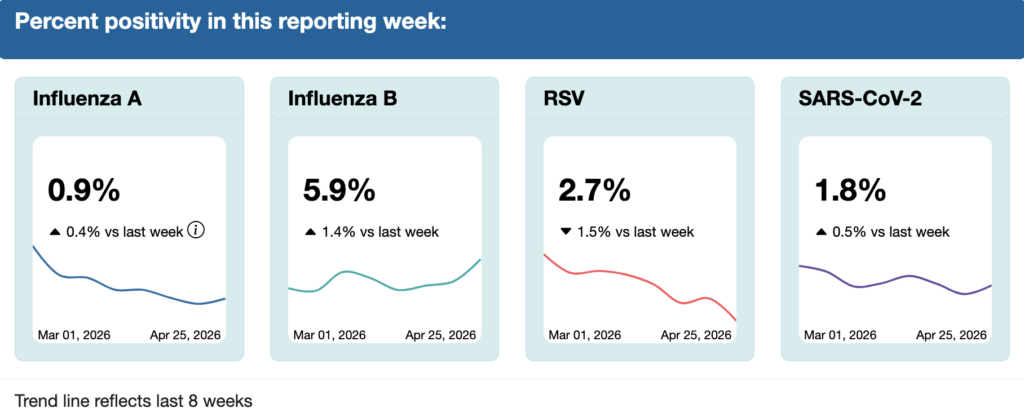
The province revised last week’s Flu B numbers downwards from last week, from 134 to 126 reported cases. I don’t think I’ve ever seen that before. That makes this week’s 166 Flu B numbers look like a big jump. Flu A also went from 13 to 24 reported cases. I’m not sure what to make of that. RSV continues to go clearly down; the others are wobbling around a little but I think it’s just noise.
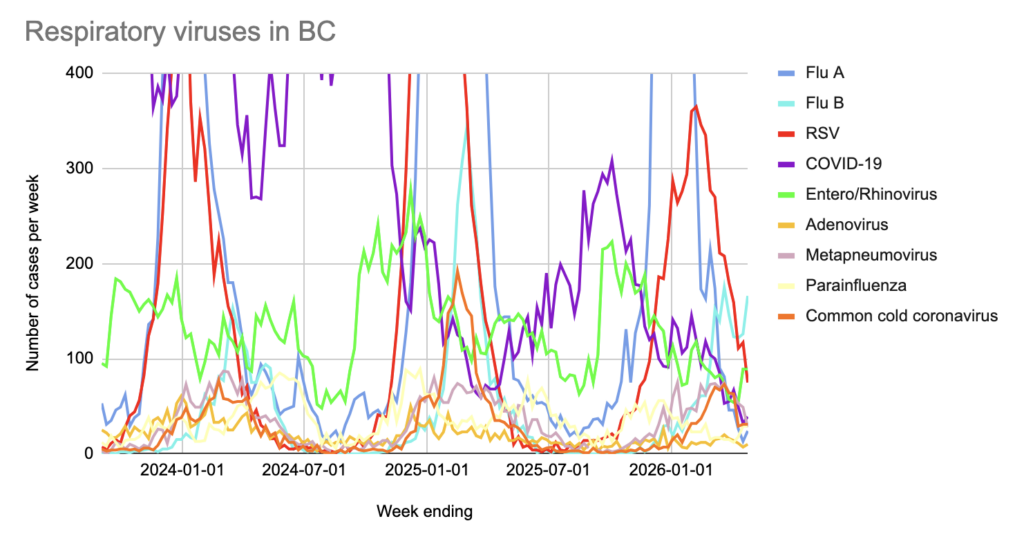
In the most recent data (ending 25 April 2026) as reported on 30 April 2026, among influenza-like illness (i.e respiratory diseases) cases that the province has test data for:
- 37.8% were influenza A or B (mostly B);
- 15.3% were RSV;
- 18.1% were entero/rhinoviruses;
- 5.7% were metapneumonia viruses;
- 7.9% were COVID-19;
- 6.3% were “common cold” coronaviruses;
- 5.9% were parainfluenza;
- 2.0% were adenoviruses.
Wastewater
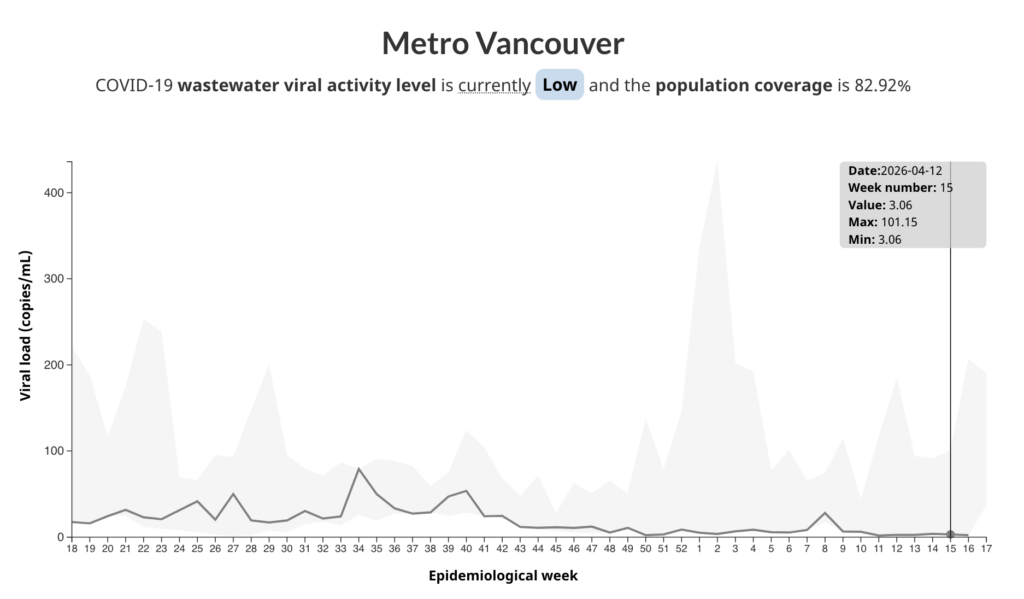
Last week I talked about how curious it was that all three wastewater treatment plants were suddenly showing zero COVID-19. I fully expected that this week’s wastewater report (for the week ending 2026-04-19) would adjust the data reported last week (for the week ending 2026-04-12) to be non-zero, but that did not happen. For the week ending 2026-04-19, two of the three wastewater plants are reported to register zeroes, but Fraser has non-zero. Maybe the numbers are real? But if so, where are the reported cases coming from?
From the Pathogen Characterization page, the number of COVID-19 cases in each Health Authority for the past few weeks has been:
| Week ending | VCH | Fraser |
| 2026-04-25 | 12 | 13 |
| 2026-04-18 | 3 | 12 |
| 2026-04-11 | 11 | 21 |
| 2026-04-04 | 16 | 22 |
Also, the federal government reports non-zero levels of COVID-19 in wastewater from Metro Van for the week ending 2026-04-12 (and the week ending 2026-04-19, for what it’s worth):
So I still don’t know what is going on.
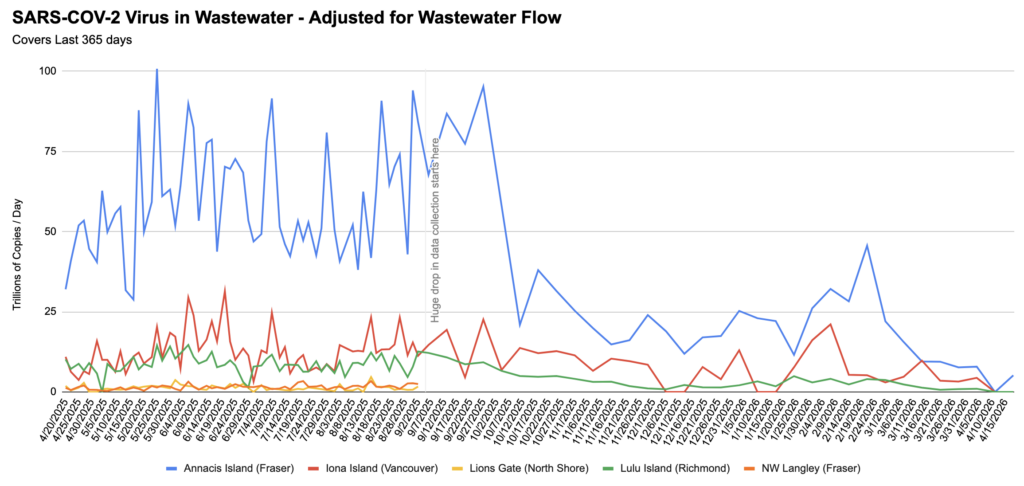
💩💧 From Jeff’s wastewater spreadsheet with data through 2026-04-19:
Recommended Reading
This is very long, so I’m not actually sure I’d recommend it, but I’m not sure where else to put it. Examining the Societal Consequences of the COVID-19 Pandemic (2024) is a very detailed discussion of all the things that went poorly as a result of the pandemic: unemployment, anti-Asian racism, domestic violence, increased alcohol/drug use, social isolation, etc. It’s similar to some of the subsets of the national COVID inquiries that the UK and New Zealand had, but I’d never heard of it.