
COVID-19
Wastewater
Jeff’s wastewater spreadsheet has pretty much always shown a higher COVID-19 concentration per litre than any of the other health authorities — by a large margin.
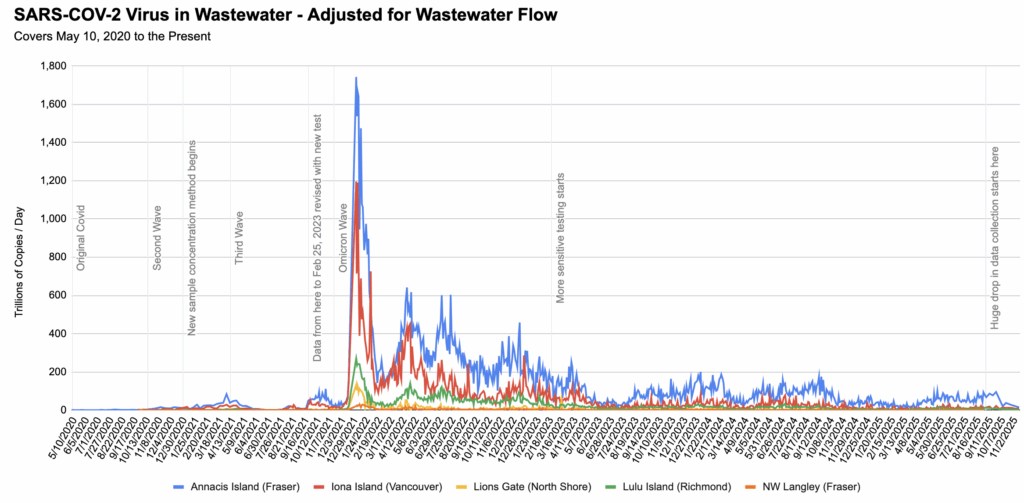
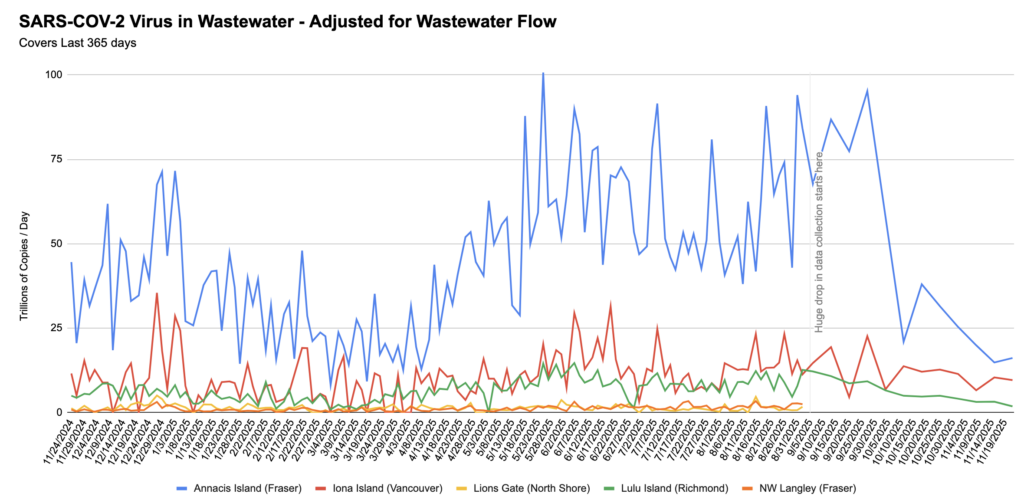
This summer, for example, Fraser levels were four or five times higher than Vancouver and Richmond:
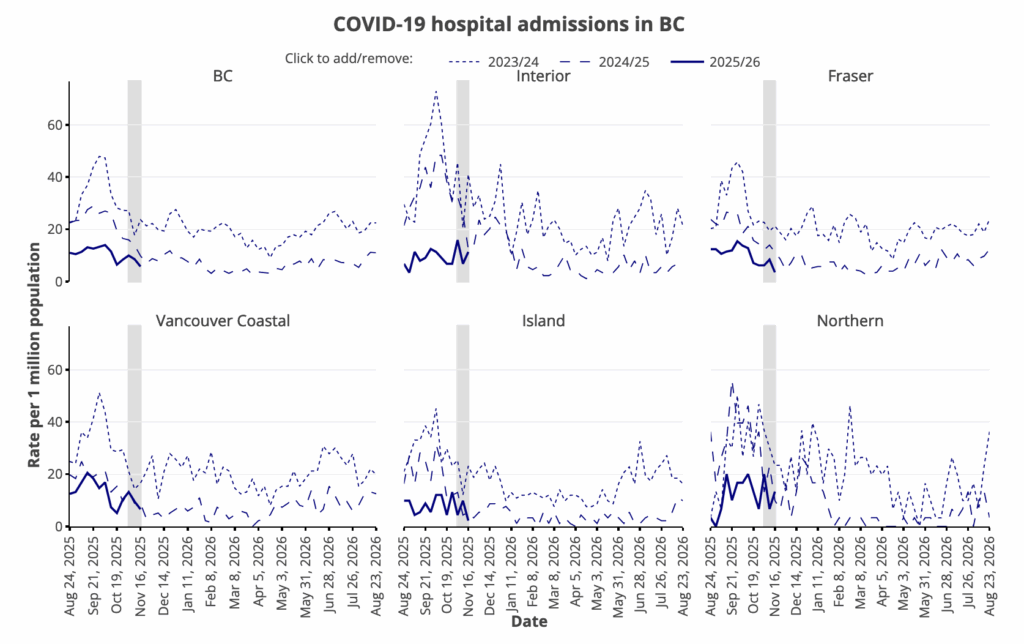
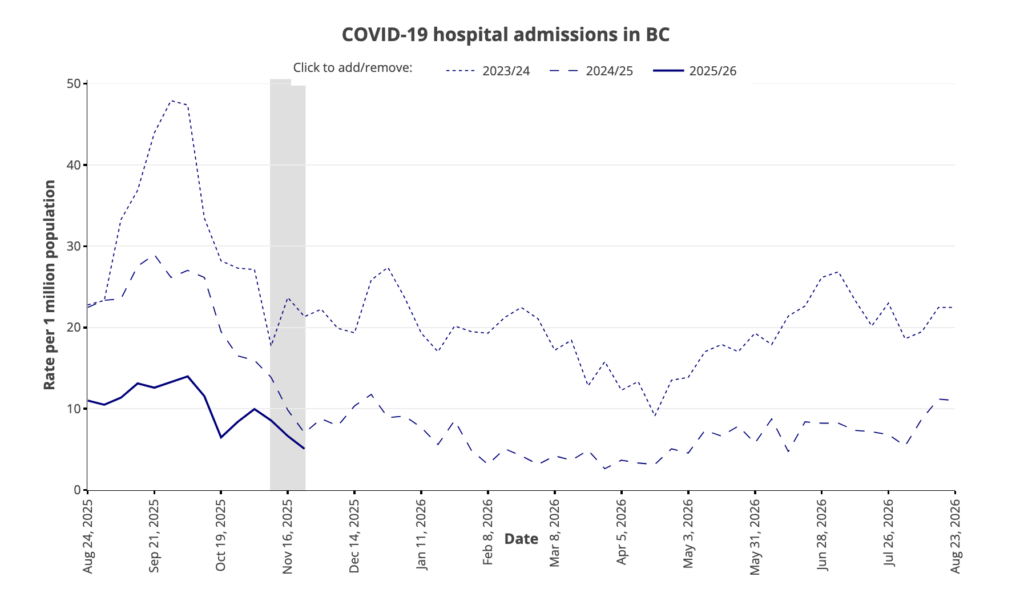
I dug into the by-HA records. Fraser Health Authority might have had slightly higher COVID-19 levels than VCH as seen in the case counts and hospital admissions:
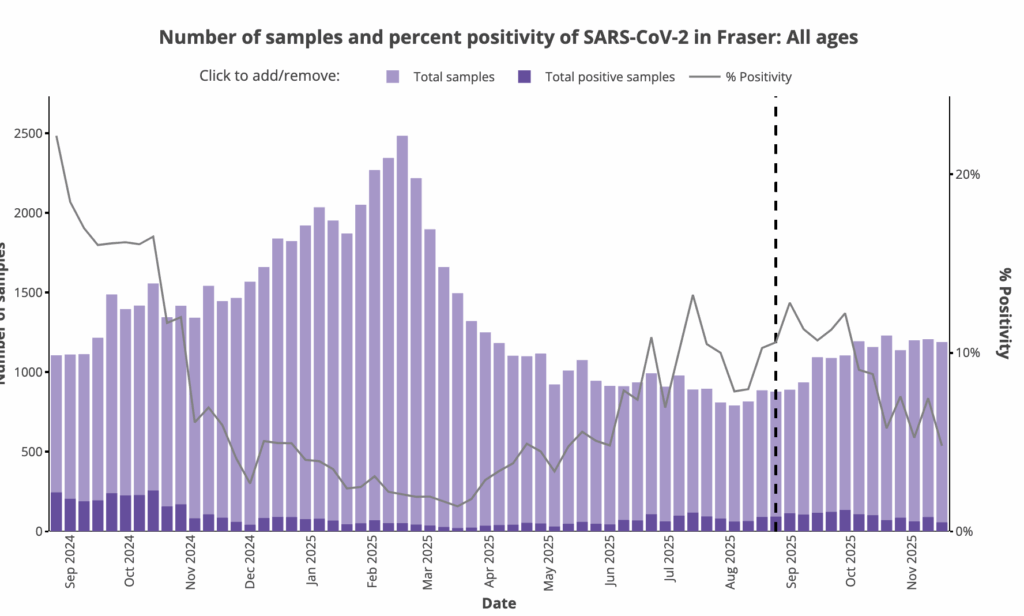
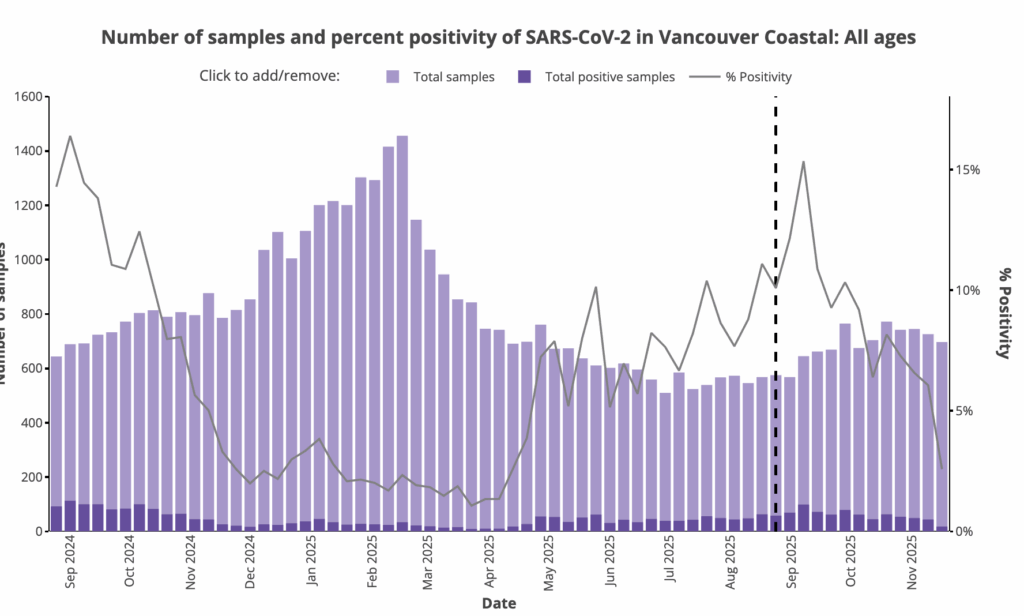
But 1) Fraser Health serves 44% more people than VCH and 2) the levels aren’t that different! From 2025-08-24 to 2025-09-21, Fraser Health had 553 cases while VCH had 360 cases. Just based on population alone, one would expect 518 Fraser cases for 360 VCH cases, so 553 Fraser Health cases is only about 6% higher in cases per capita. Meanwhile, Fraser Health wastewater levels were about 3 times higher.
So what do I think this sudden, dramatic drop in the Fraser Health wastewater means? I think it means that one of their superpoopers died. 🙁
What’s a superpooper? My term for someone who sheds a hugely higher number of viral particles than average amount. For example, this article (2025-06-08), for example, describes a mystery superpooper who pooped “probably a few trillion virus particles a day”.
For anther example, this summer, there was a HUGE spike in Coeure d’Alene, Idaho:
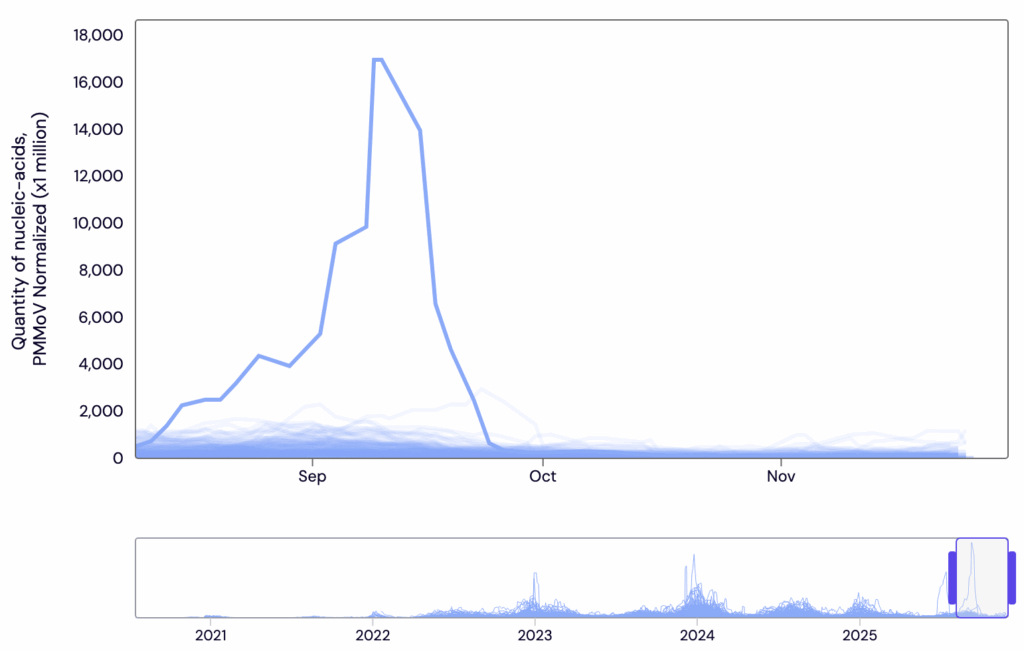
The lines at the bottom? Those are every other sewershed in the USA. The Coeure d’Alene sewershed was an extreme outlier; the quick rise and even faster fall probably means that all that was coming from just one person.
So. This is why I think that Fraser’s high wastewater COVID-19 levels might have been from one person.
Charts
From the Viral Pathogen Characterization page:
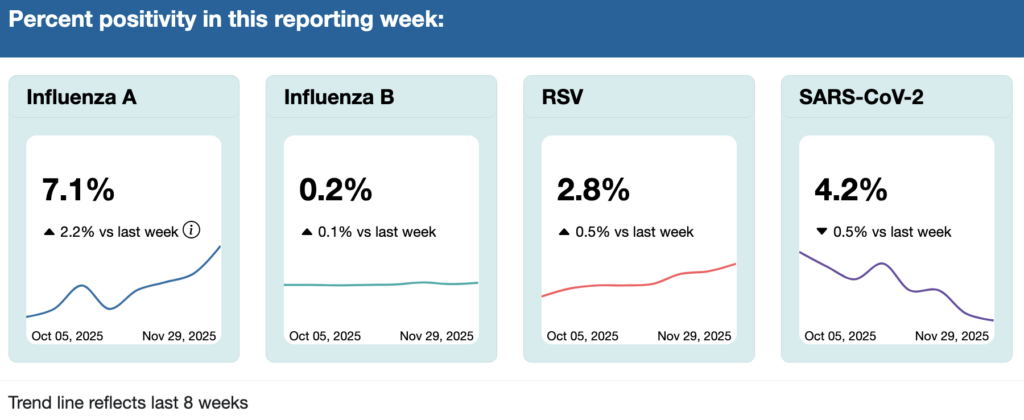
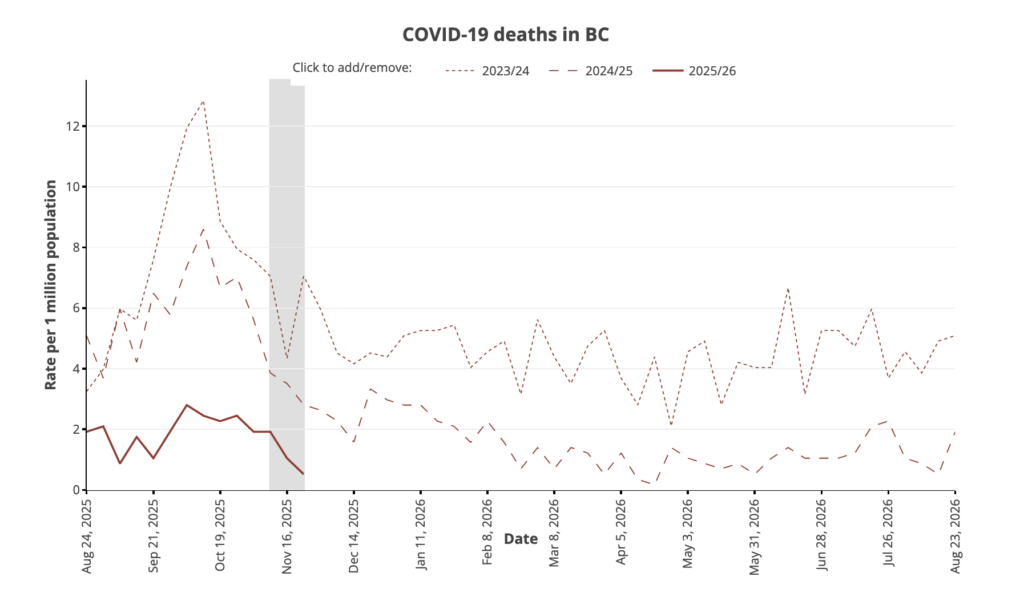
Flu crossed over COVID-19 last week, but it wasn’t so easy to tell from the graph. This week, it’s pretty obvious. I expect that RSV will overtake COVID-19 in next week’s data dump.
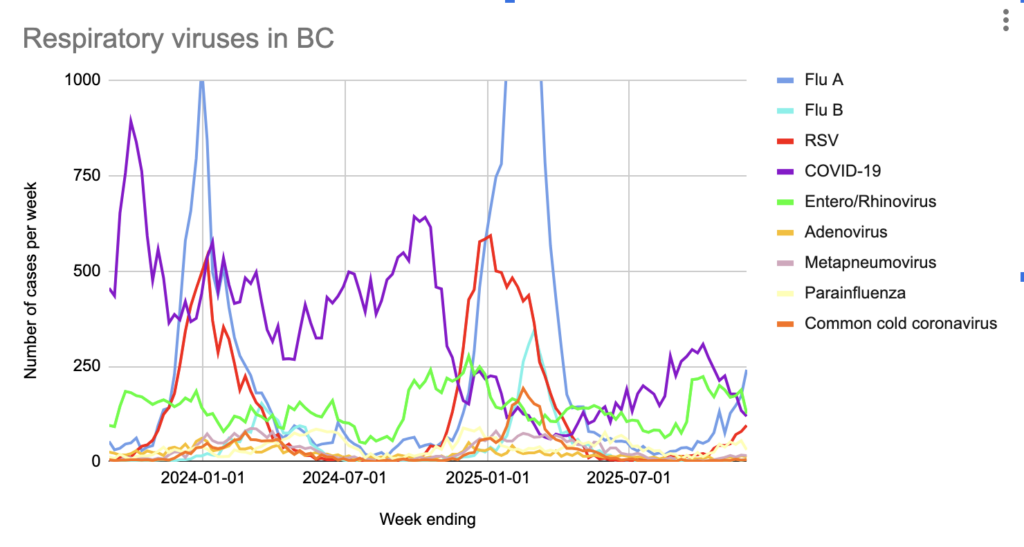
In the most recent data (ending 29 Nov) as reported on 4 Dec 2025, among influenza-like illness (i.e upper respiratory diseases) cases the province has test data for:
- 37.9% were influenza A or B;
- 19.4% were entero/rhinoviruses;
- 18.3% were COVID-19;
- 14.6% were RSV;
- 4.8% were parainfluenza;
- 2.5% were metapneumonia viruses;
- 1.8% were adenoviruses;
- 0.8% were “common cold” coronaviruses.