Charts
DAMMIT. The province is not going to give us the number of people with COVID-19 in hospital any more. 😠
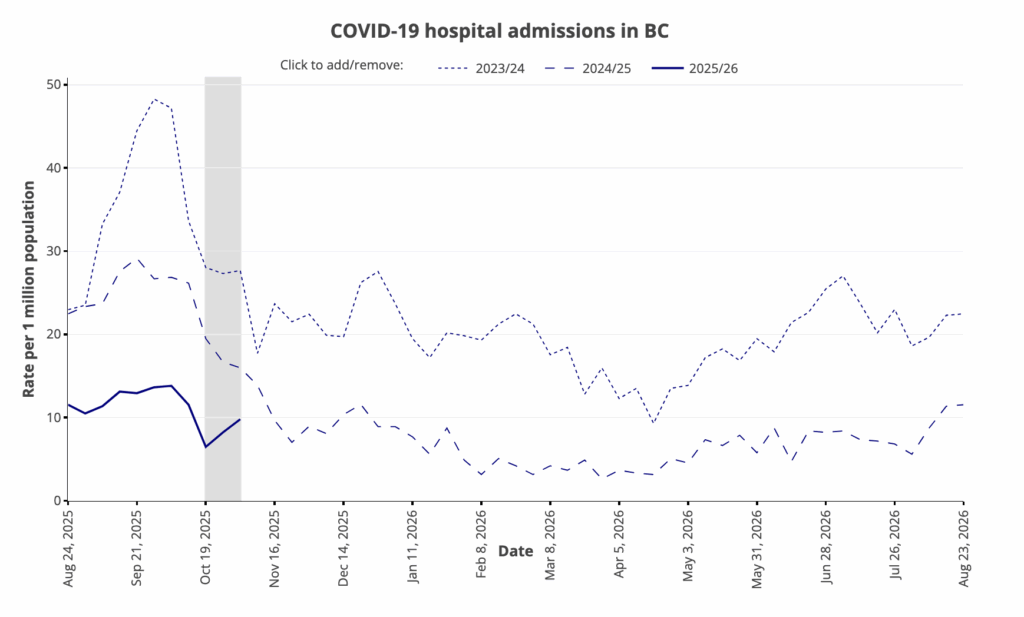
From the Viral Pathogen Characterization page:
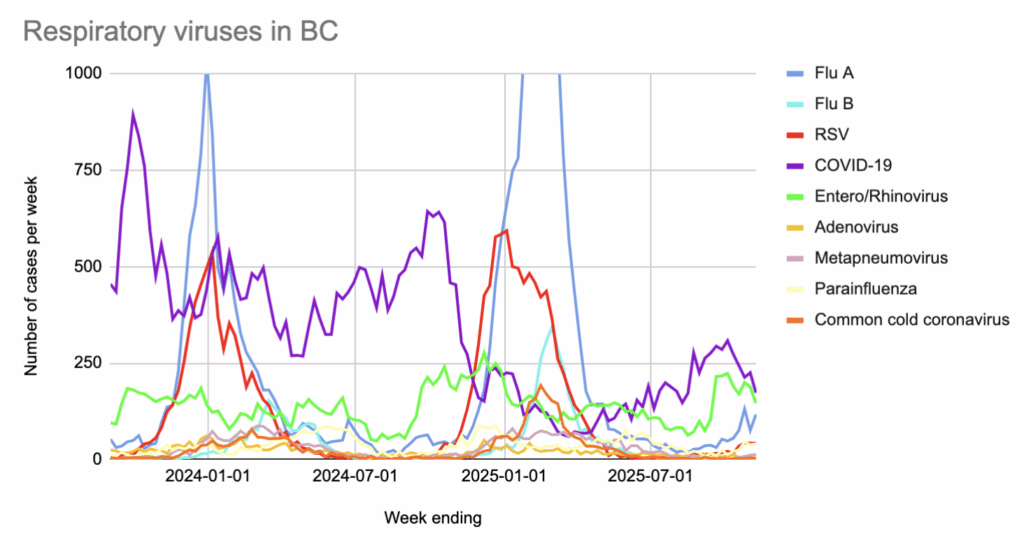
I would like to point out that for the past three years, the peaks of COVID-19 cases (as measured by the province) have all been in early October or late September. (Note that it’s a lot harder to spot any seasonality in the wastewater levels, so the case count might reflect who-gets-tested more than what-is-circulating. I would say, “maybe people don’t get tested around the holidays”, except that clearly they do — see how large the flu and RSV peaks are around the holidays.)
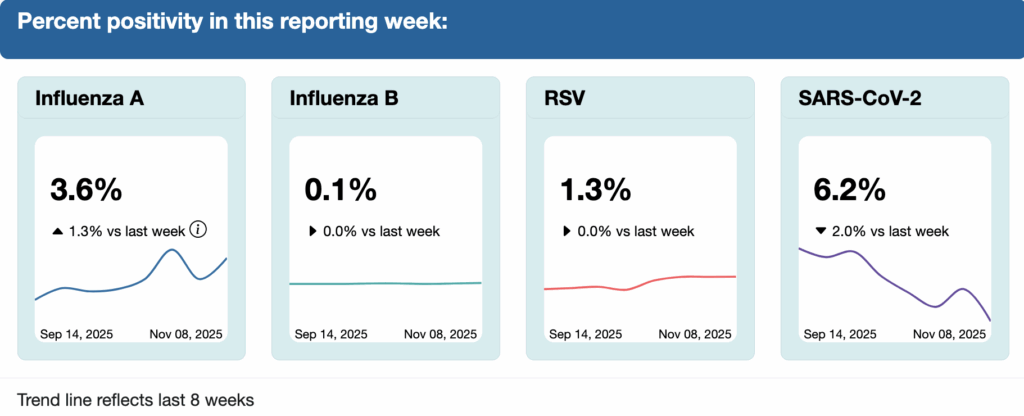
In the most recent data (ending 8 Nov) as reported on 13 Nov 2025, among influenza-like illness (i.e upper respiratory diseases) cases the province has test data for:
- 31.6% were COVID-19;
- 26.6% were entero/rhinoviruses;
- 21.7% were influenza A or B;
- 7.7% were RSV;
- 7.5% were parainfluenza;
- 2.4% were metapneumonia viruses;
- 2.0% were adenoviruses;
- 0.5% were “common cold” coronaviruses.
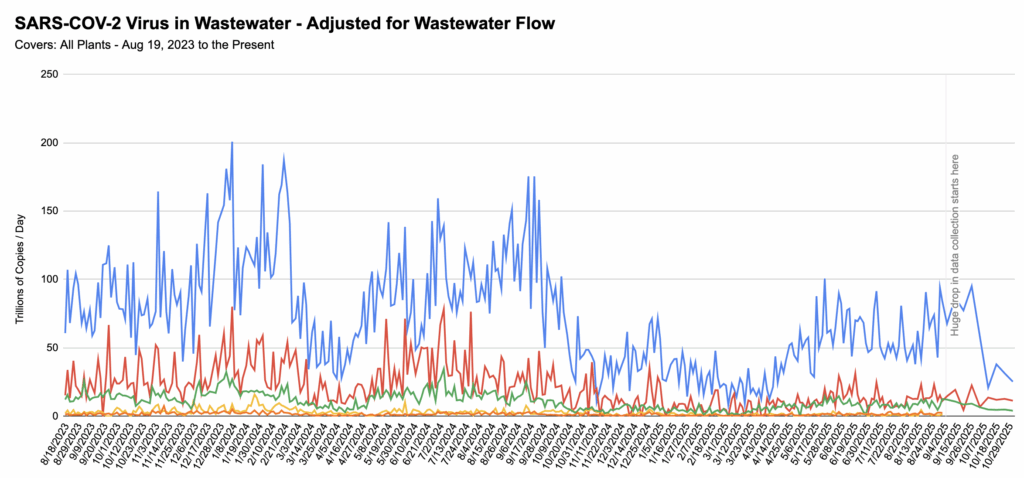
Wastewater
💩💧 From Jeff’s wastewater spreadsheet:
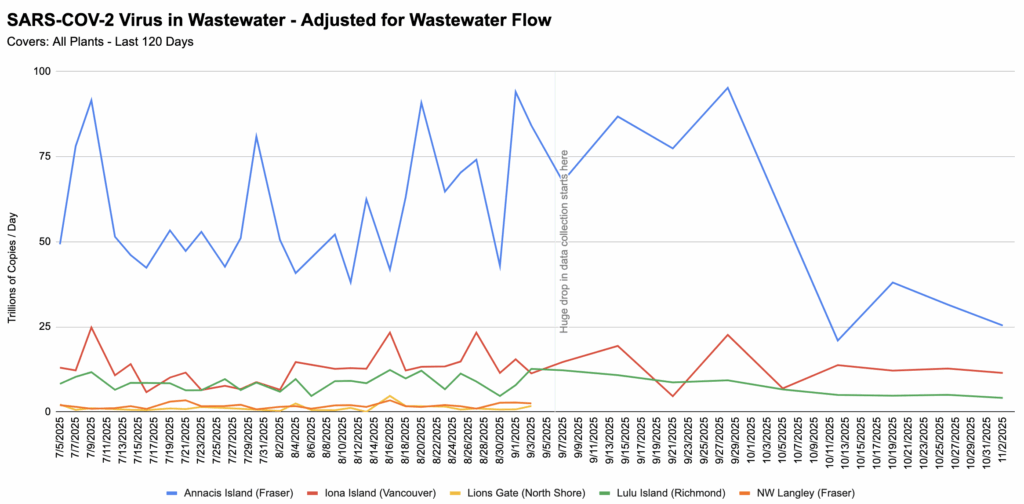
Wastewater levels are not the lowest they’ve been in the past few years, but they are close to the lowest.