NB: I’m travelling this week, so a bit behind.
We have gotten into respiratory illness season, so the province is providing weekly updates again, yay!
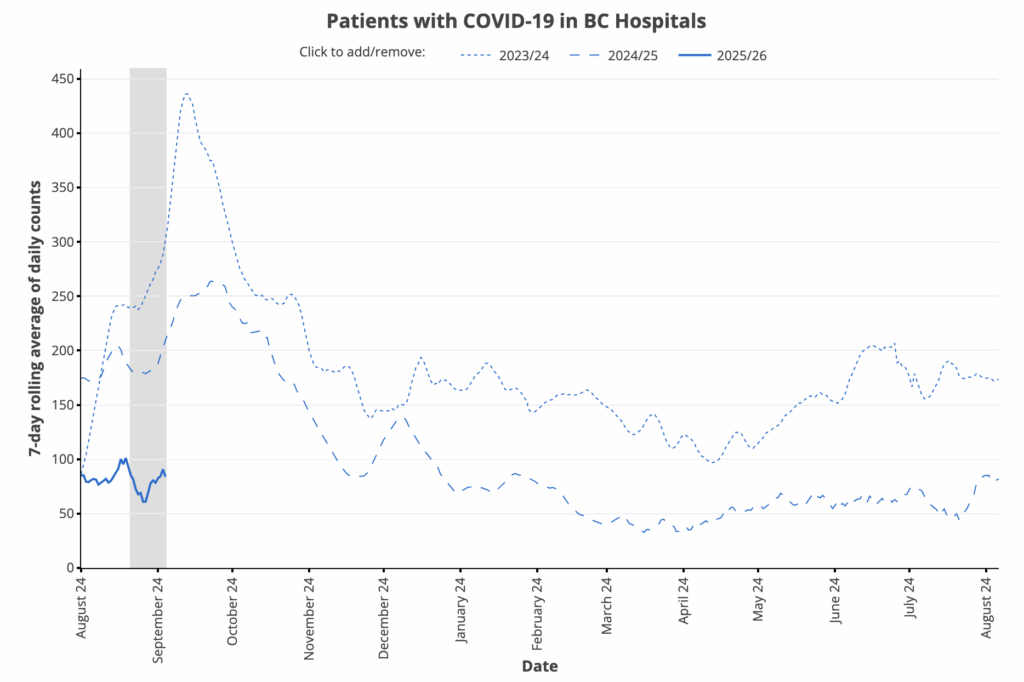
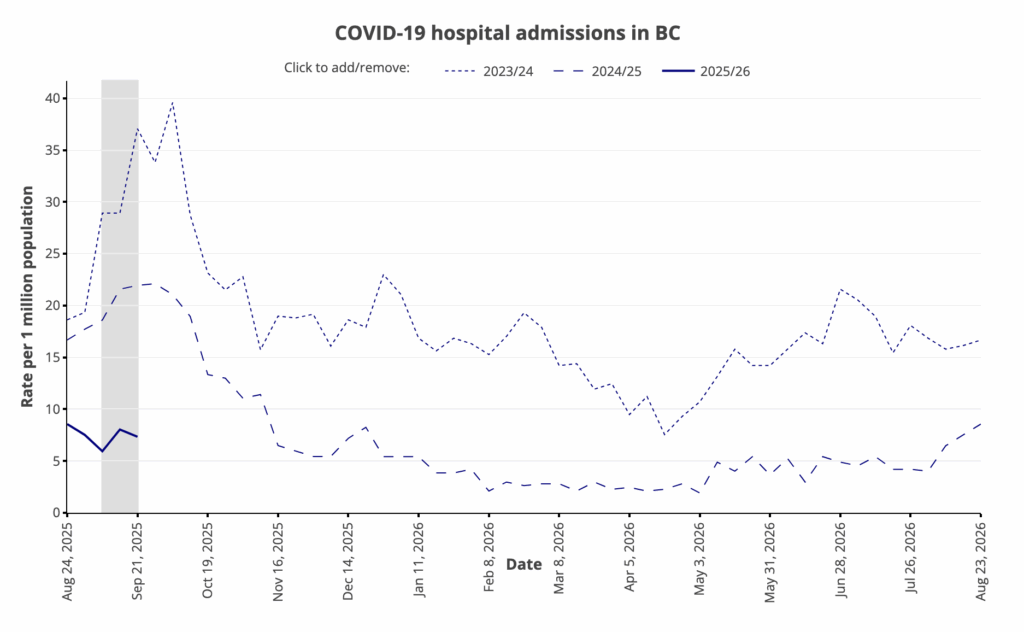
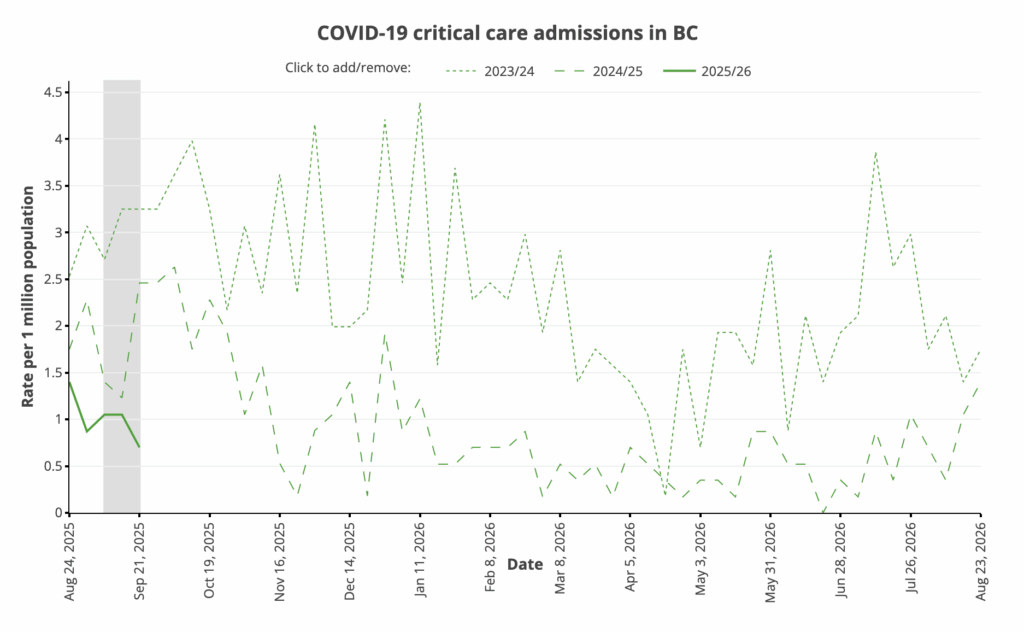
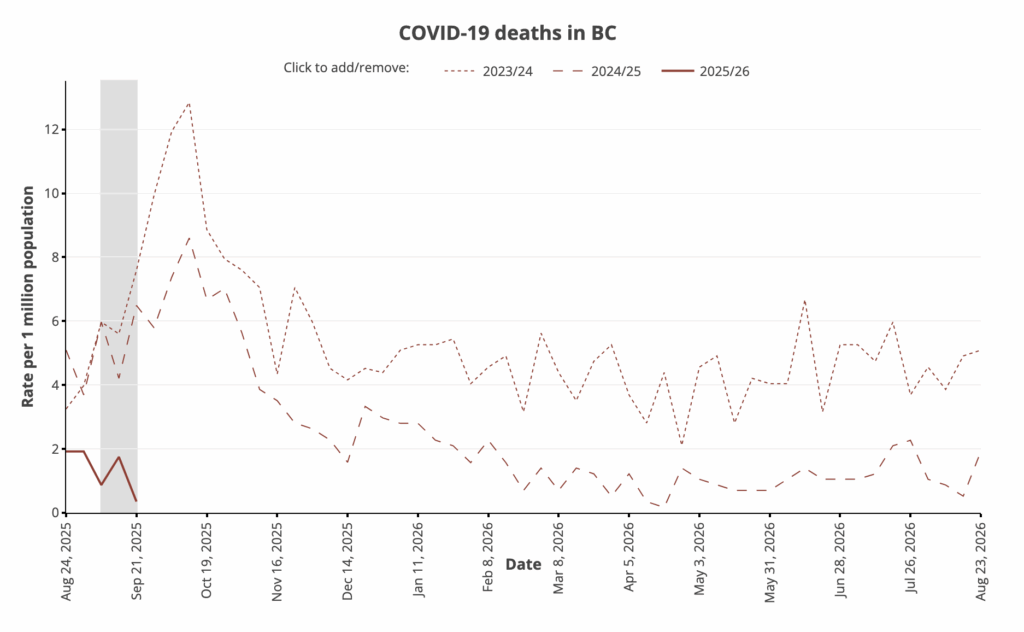
The COVID-19 hospital/death charts look like maybe COVID-19 levels are going down, but the number of cases still looks like it is going up slowly. My any of the measures, it looks like COVID-19 levels are significantly lower than in previous years. (Hopefully it’s not just because they aren’t testing any more.)
Charts
From the Viral Pathogen Characterization page:
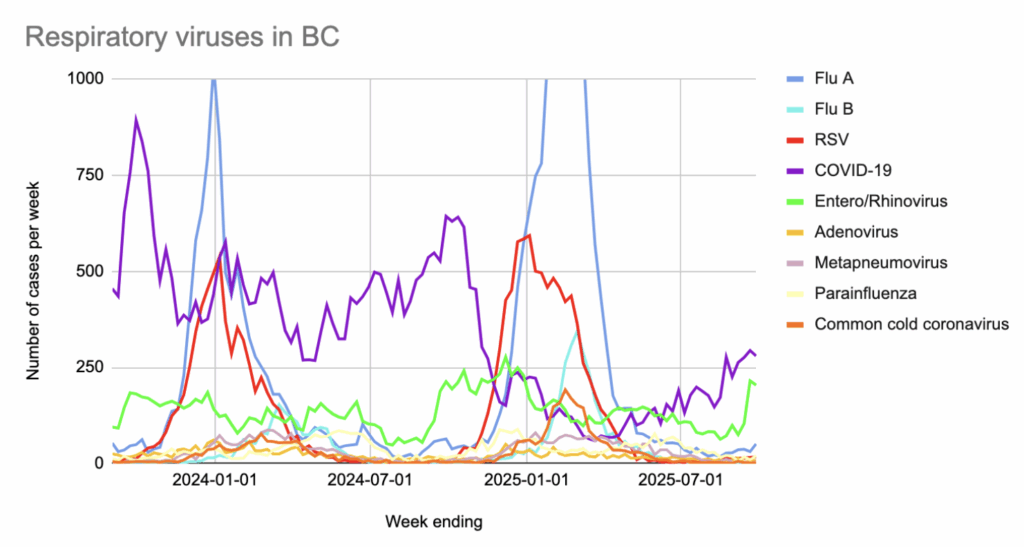
In the most recent data (ending 30 August) as reported on 4 September 2025, among influenza-like illness (i.e upper respiratory diseases) cases the province has test data for:
- 47.9% were COVID-19;
- 34.9% were entero/rhinoviruses;
- 8.7% were influenza A or B;
- 3.4% were parainfluenza;
- 2.9% were RSV;
- 1.2% were adenoviruses;
- 0.7% were metapneumonia viruses;
- 0.3% were “common cold” coronaviruses.
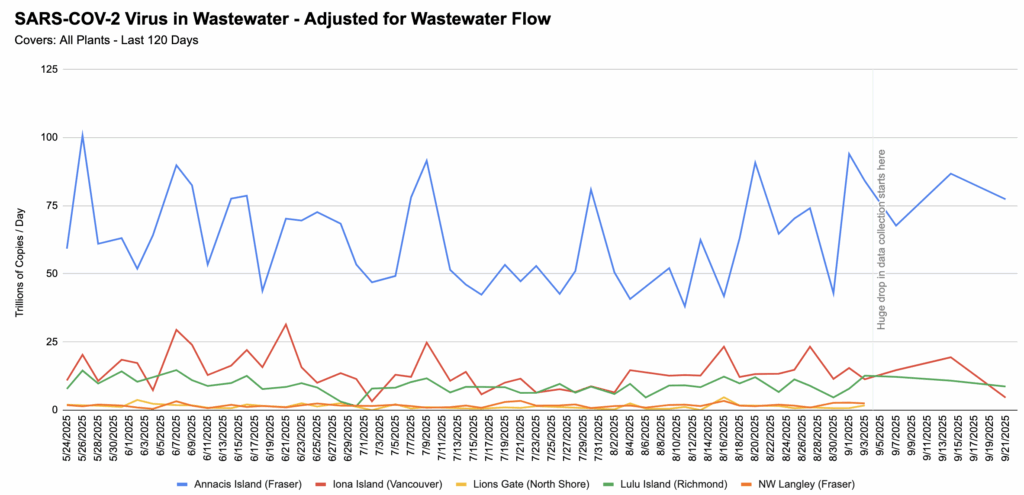
Wastewater
💩💧 From Jeff’s wastewater spreadsheet: