COVID-19 levels keep rising steadily, but more slowly than I had expected, given how NB.1.8.1 hammered Asia.
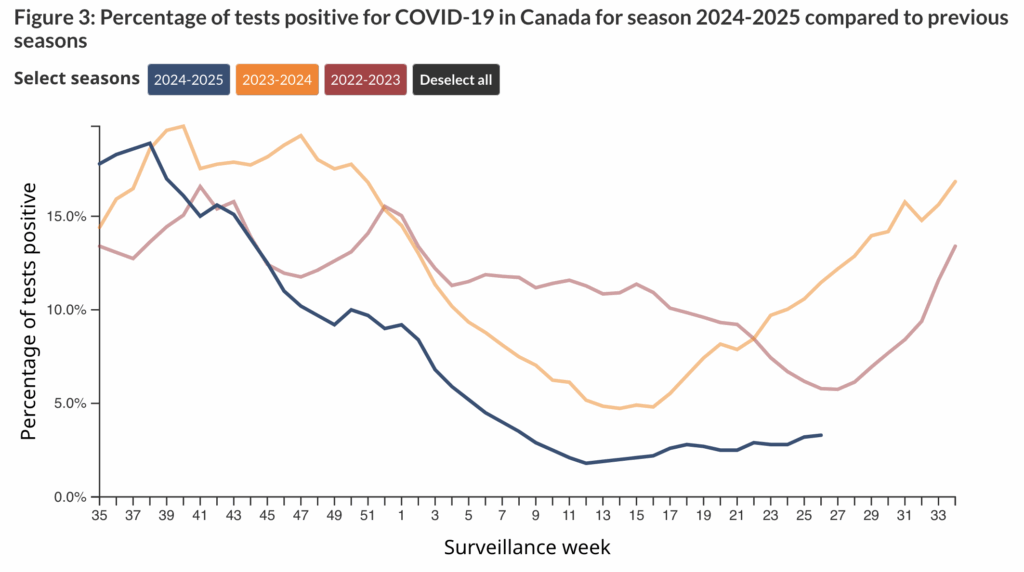
This chart from the Government of Canada’s COVID-19 page shows that the rise in COVID positivity is much shallower this year (blue) than in previous years.
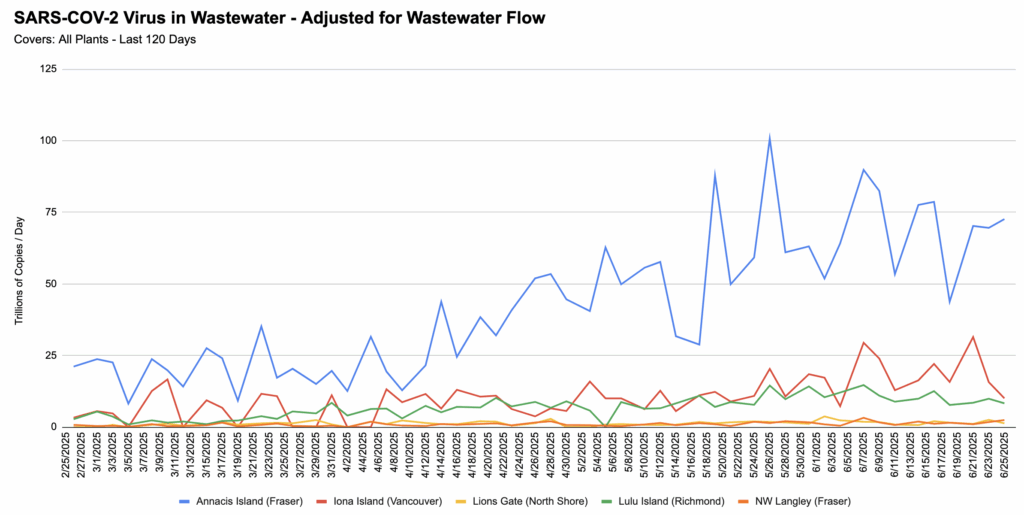
Wastewater from Fraser and Richmond are actually coming down. Maybe. (Maybe it’s noise, hard to tell.)
Charts
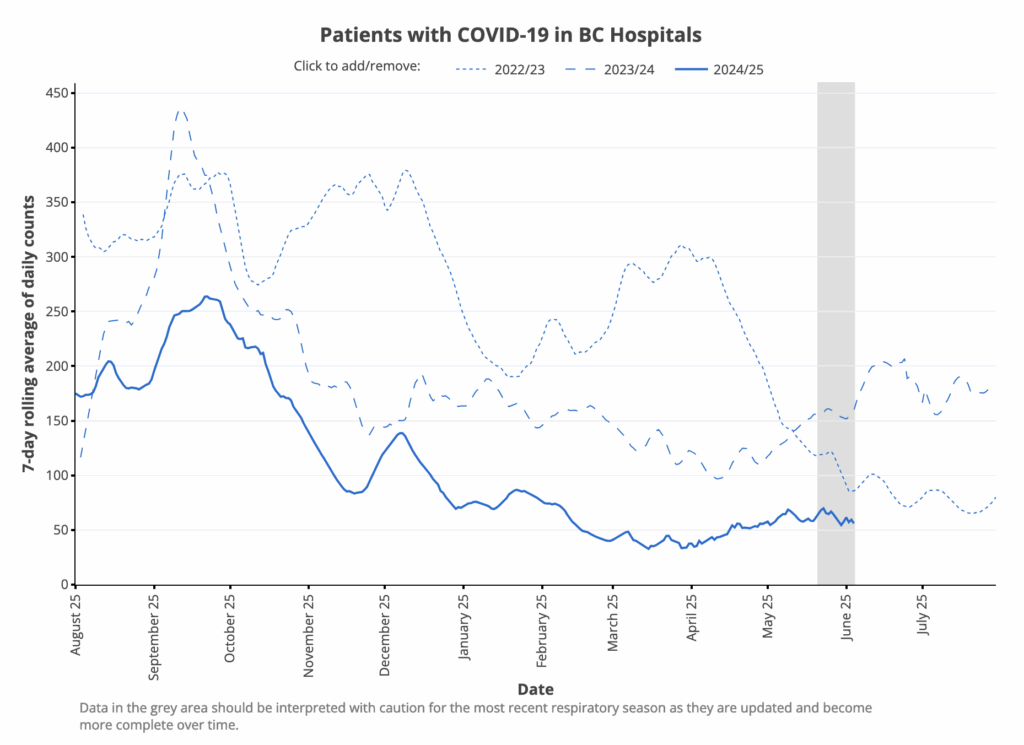
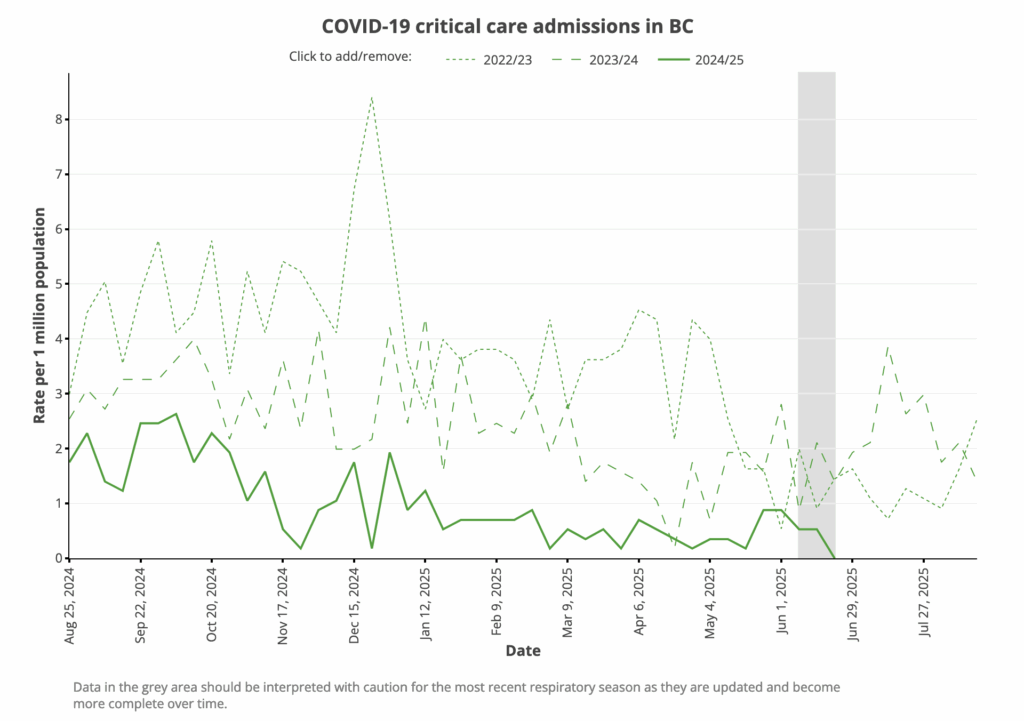
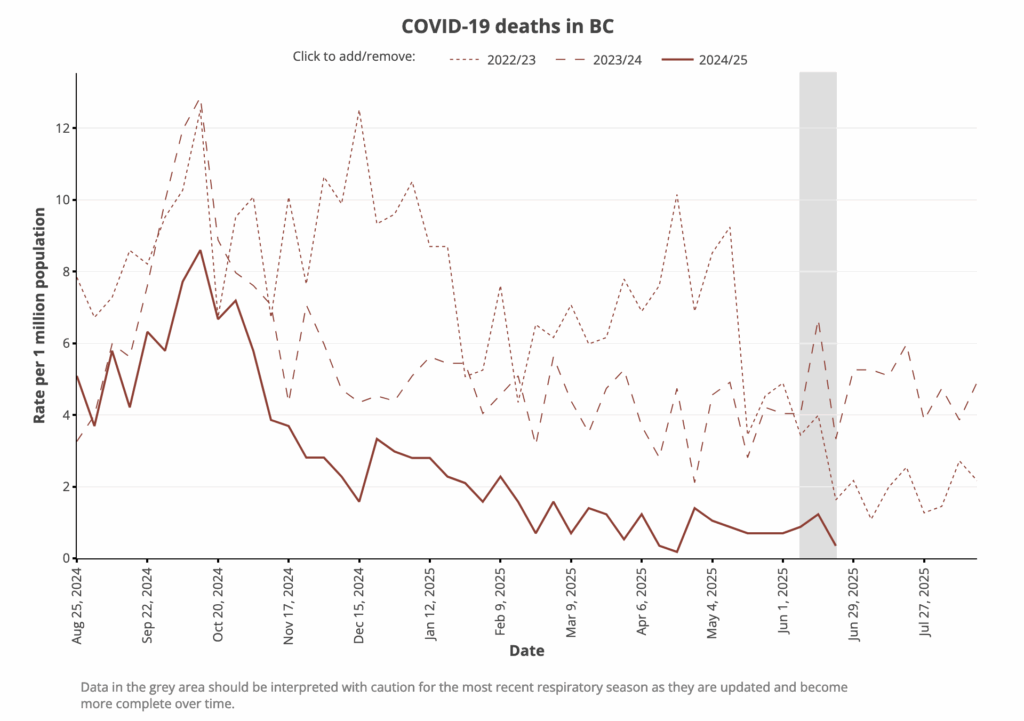
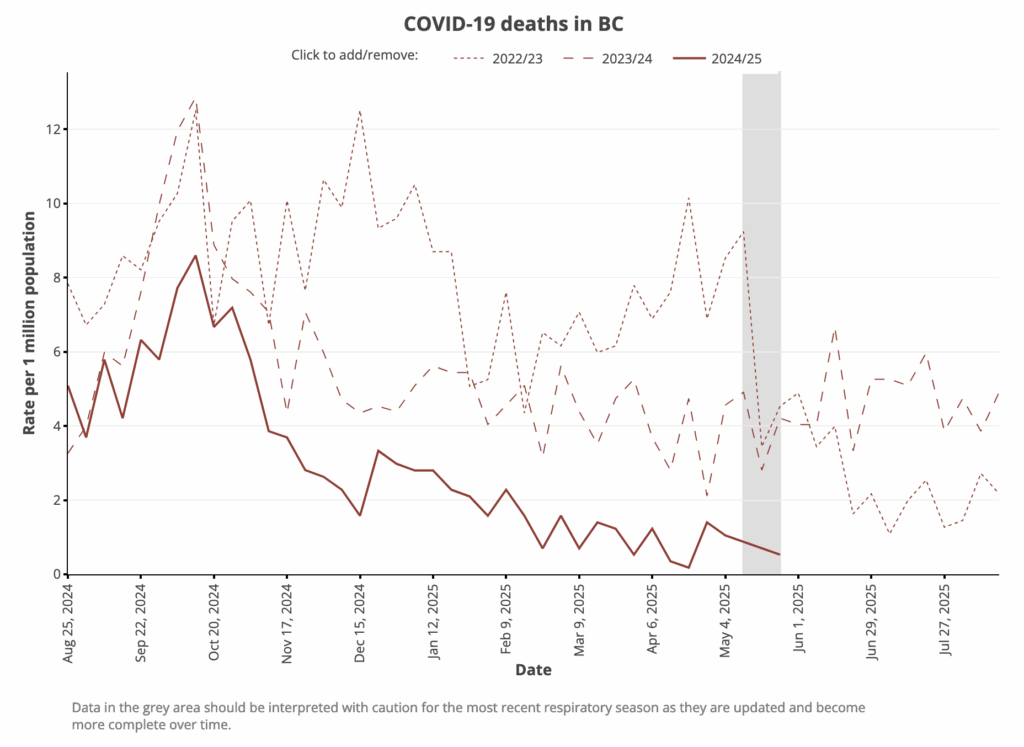
From the BC Viral Respiratory Outcomes Report:
Comparison of COVID-19 vs. Other Influenza-Like-Illnesses, from the Viral Pathogen Characterization page:
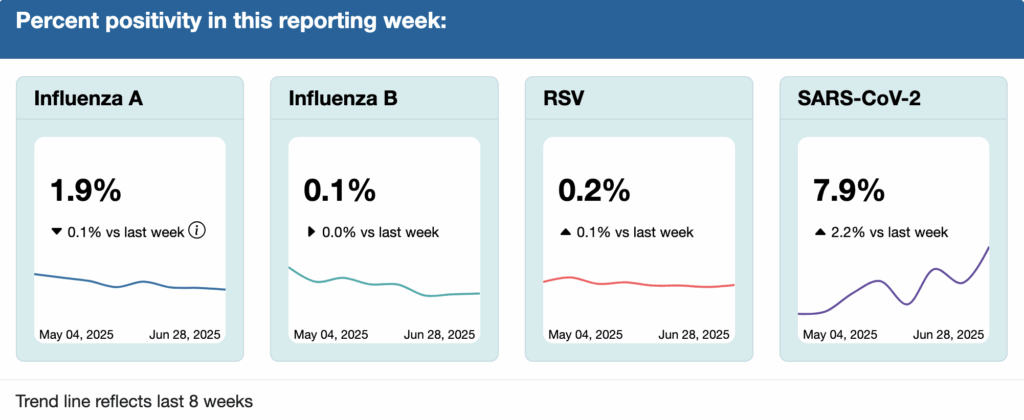
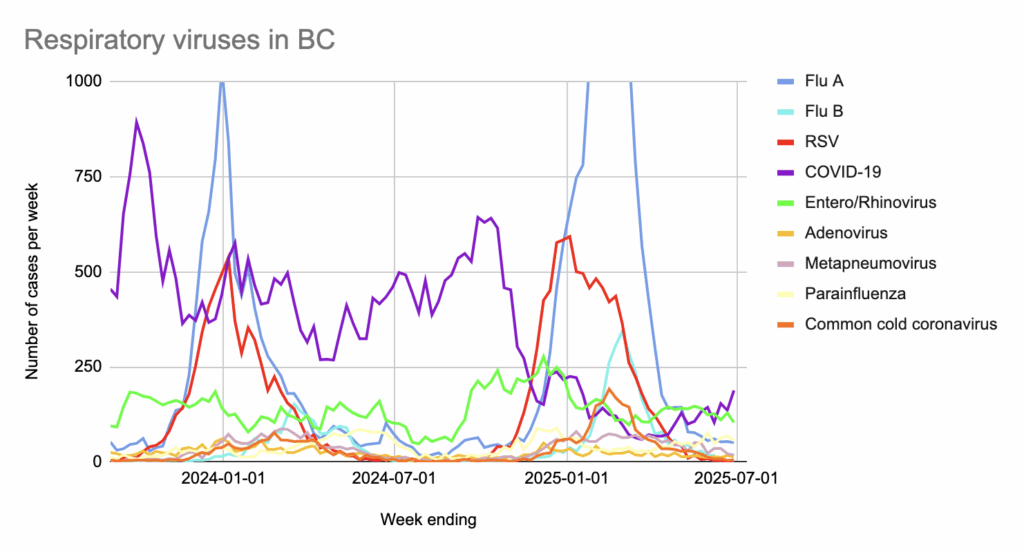
In the most recent data (ending 31 May) as reported on 5 June 2025, among influenza-like illness (i.e upper respiratory diseases) cases the province has test data for:
- 31.6% were COVID-19;
- 24.9% were entero/rhinoviruses;
- 16.4% were influenza A or B;
- 15.7% were parainfluenza;
- 5.1% were metapneumonia viruses;
- 2.6% were “common cold” coronaviruses;
- 2.0% were RSV;
- 1.8% were adenoviruses.
Wastewater
From Jeff’s wastewater spreadsheet: