Hospitalizations
Buried in yesterday’s slides (on p.15) was information about hospitalizations: there were 1014 cases from December and 862 cases from March. The slides said that the month was when the case was reported, not when the patient was hospitalized, which means that I can compare against the number of cases reported that month!
In Dec: 5.41% of the cases were ever hospitalized
In Mar: 4.4% were ever hospitalized
The difference has got to be vaccinations. Vaxxing started in LTCH in mid-Dec, and it would have been Jan before people’s immune systems got up to speed. By March, the LTCH had been well-vaccinated.
I was surprised that it was an entire percentage point. I guess I should not have been.
Statistics
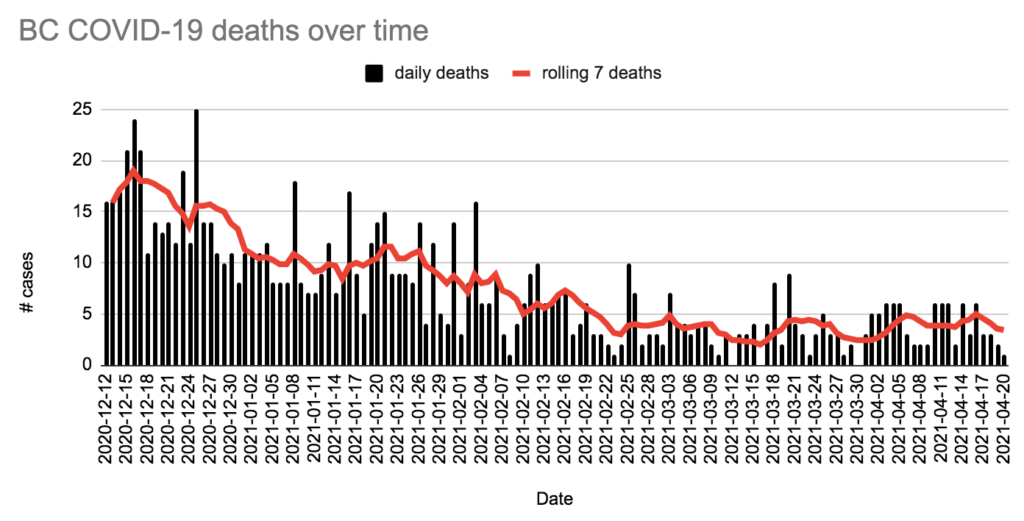
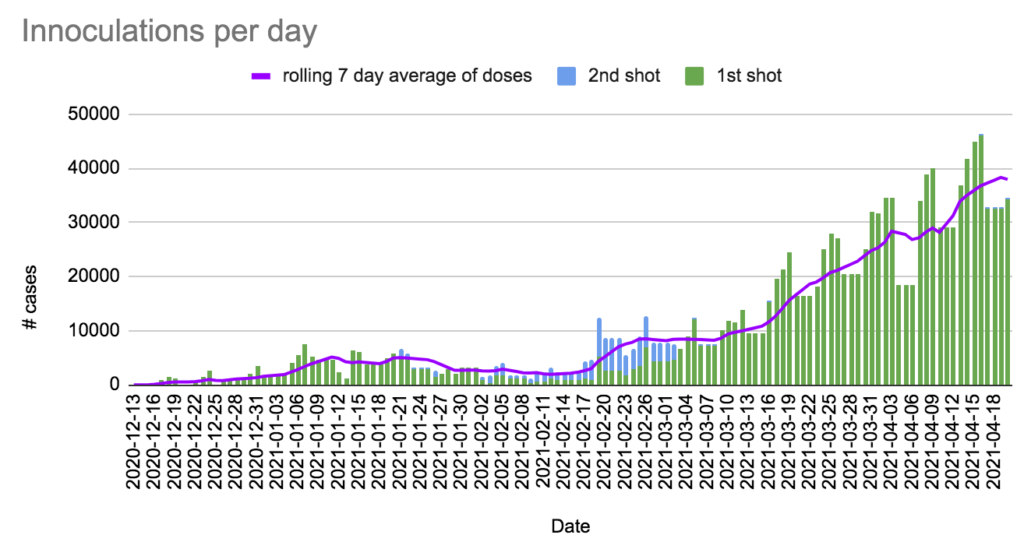
+849 cases, +1 death, +34,372 first doses, +112 second doses, of which +6265 were AZ.
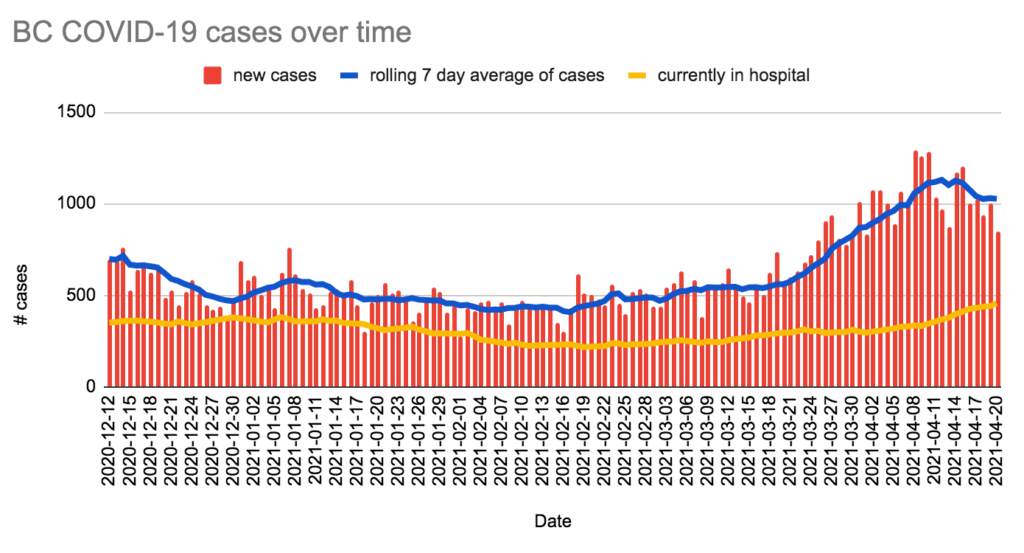
Currently 456 in hospital / 148 in ICU, 9,145 active cases, 13,679 under monitoring, 109,973 recovered.
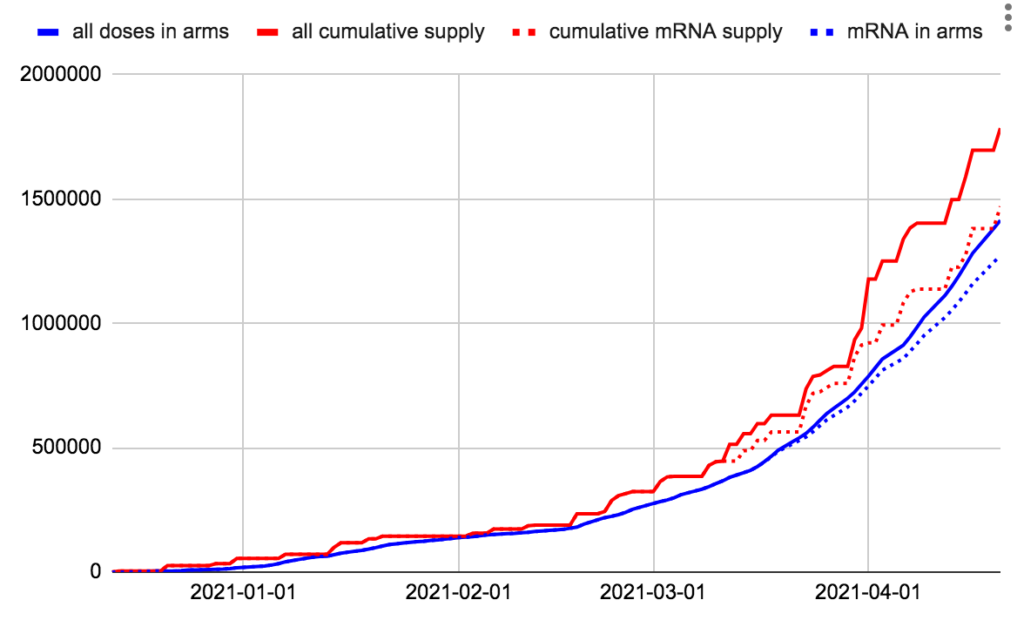
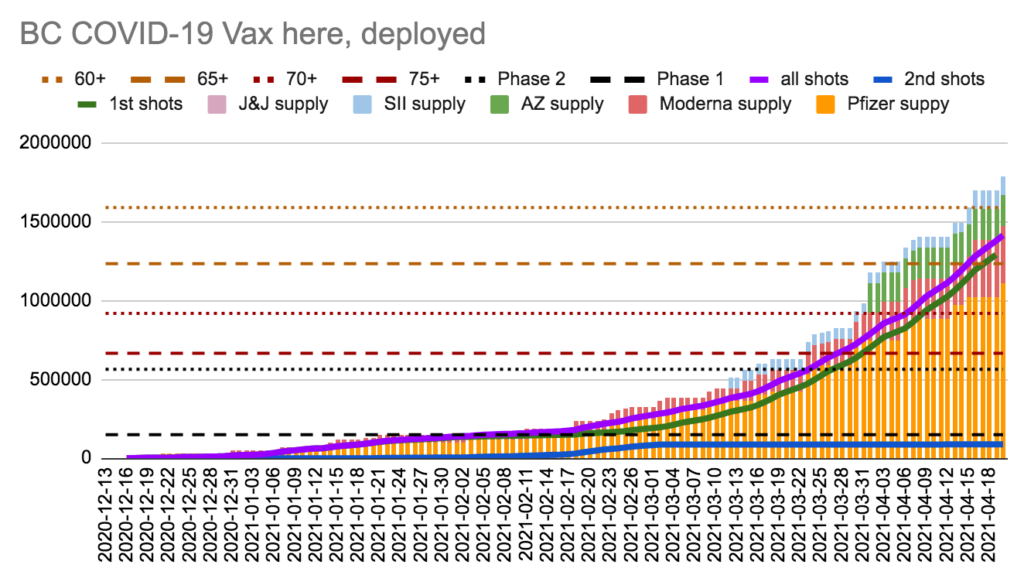
We have 370,646 doses in the fridges, which we will use in 10.75 days at today’s rate. We have given more shots than we had received by 8 days ago.
We have 197,714 doses of mRNA in the fridges, which we will use in 7.0 days at today’s rate. We have given more shots of mRNA than we had received by 5 days ago.
We have 172,932 doses of AZ in the fridges, which we will use in 27.6 days at today’s rate.
Note: The AZ rate seems low, as there were many reports on social media of people rushing to pharmacies, booking slots getting filled up for days in advance, etc. This might be a reporting issue. I suspect that the figures are something like noon yesterday to noon today, and the opening of slots was not announced until after 3pm. If that is why the AZ vaccinations didn’t spike yesterday, we should see a spike tomorrow.
Extra Charts
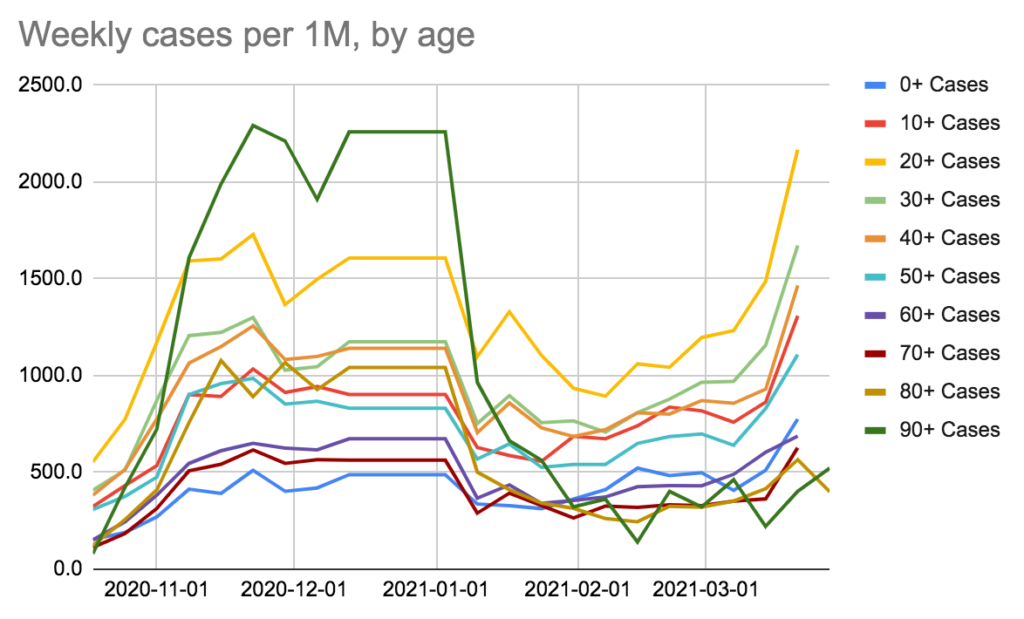
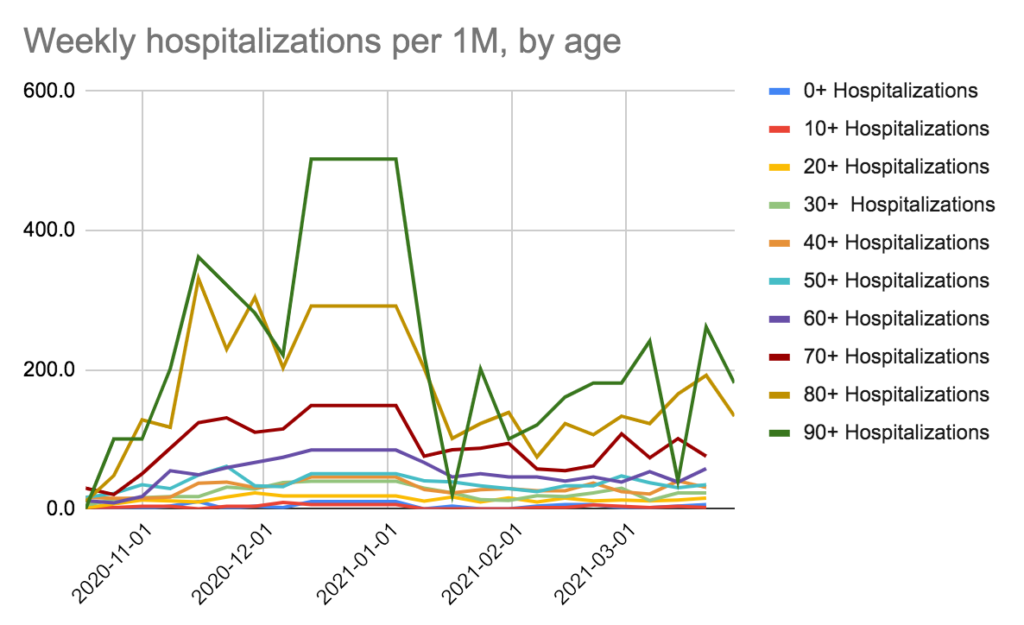
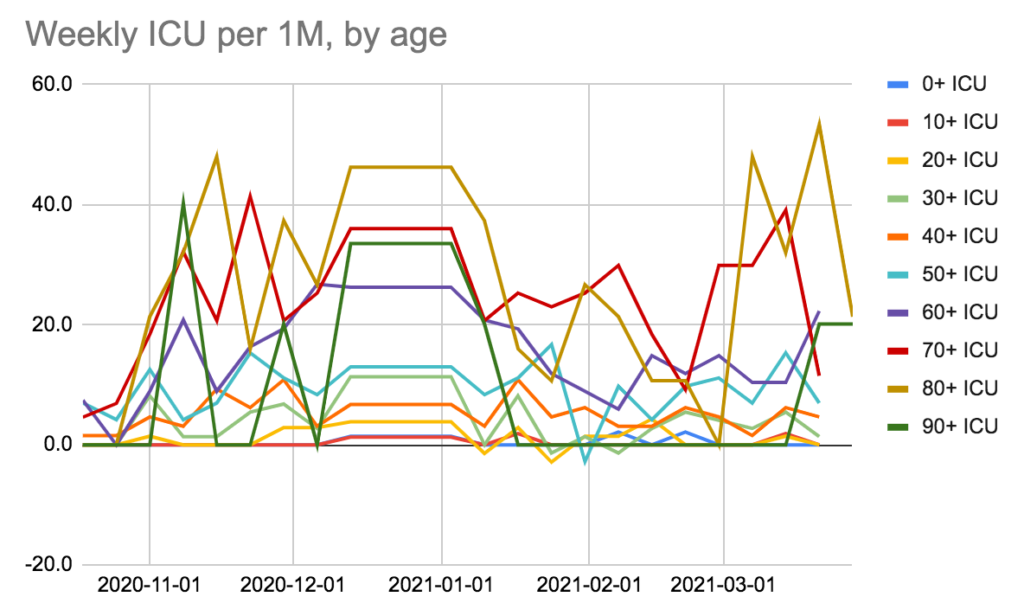
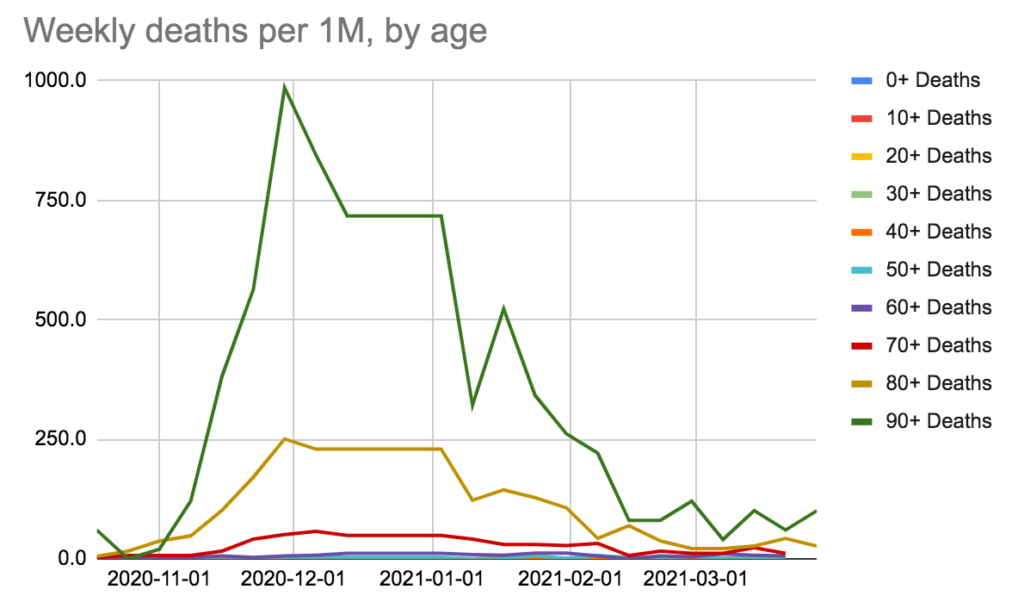
Today I made cases/hospitalizations/ICU/deaths chart per capita by age between from 18 Oct to 28 March, using data from the Situation Reports. NB: they didn’t issue Situation Reports in the last two weeks of 2020, so I averaged them out for those three weeks, that’s why you see plateaus in Dec.
Here we see “vaxxes work #1” — the over 90s (dark green line) has stayed down recently despite it going up for every other age group. The mass vax clinic 85+ started hit their 2-week immunity the day after this chart finished, but some of them would have been vaxxed as part of the LTCH vaccination.
I thought it was interesting that the 70 y/os (brick colour) was as low as it is. Maybe 70 is old enough that they stay home and young enough that they aren’t that susceptible? Maybe 70 is old enough to get scared and hide at home?
Next, hospitalizations. You can see that hospitalization really really does correlate with age: the over-60 crowd really has a much higher hospitalization per capita rate.
The 70+ and 80+ are still going into ICU, but not the 90s. (Vax works!) I found it interesting that the ICU rate for the 90+ was higher in December than for the 70+ and 80+ cohort. Maybe if you are that old, you die before you get to the ICU? I dunno.
The deaths by age made me gasp, it was so stark. Also — vax works!
Regular Charts
